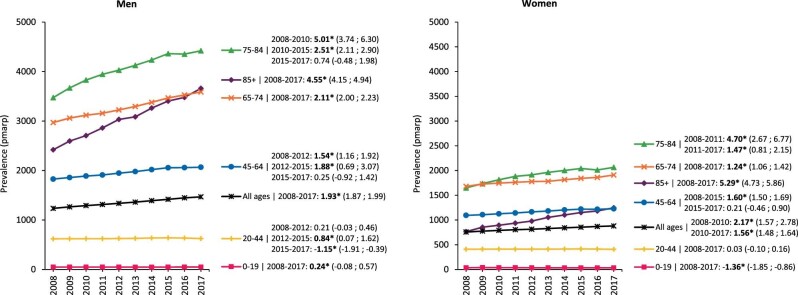
FIGURE 4:
Standardized prevalence of KRT pmarp (per million age-related population) in men and women, stratified by age group. For standardization the age and sex distribution of the EU28 population in 2015 was used. Trends are indicated by the APC with corresponding 95% confidence interval. Bold numbers and an asterisk (*) indicate whether the APC was statistically significant (P < .05).

