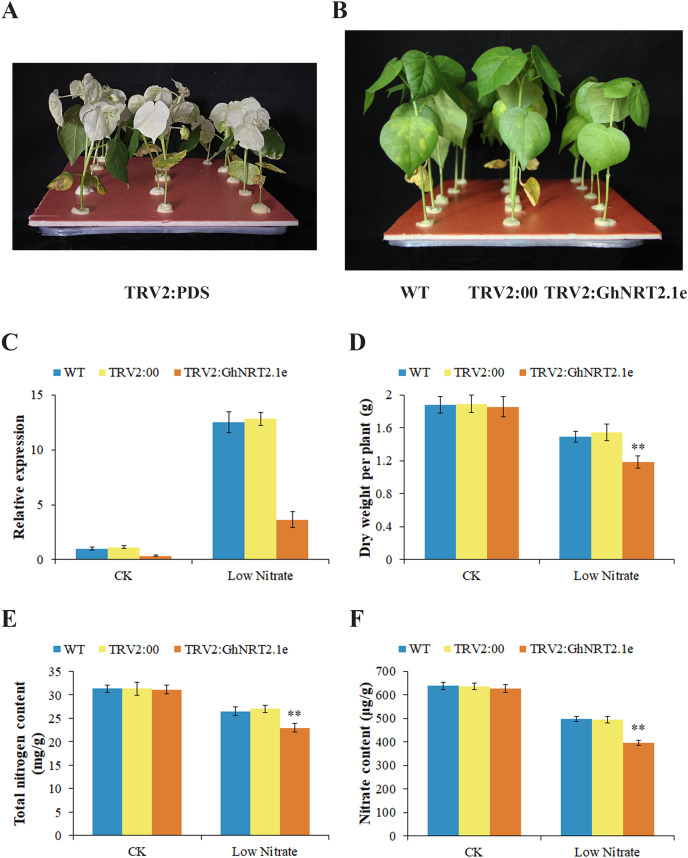
Figure 11. Phenotypic observation and identification of silenced plants.
(A) Albino phenotype appearance on the leaves of the TRV2:PDS infused plants. (B) The phenotype of WT, TRV2:00, and TRV2:GhNRT2.1e plants grown at 0.25 mM nitrate concentration. (C) The expression levels of GhNRT2.1e in WT, TRV2:00, and TRV2:GhNRT2.1e plants grown at 0.25 mM and 2.5 mM nitrate concentrations were analyzed by qRT-PCR. The GhActin gene was used as the internal control. Comparison of dry weight (D), total nitrogen content (E), and nitrate content (F) of WT, TRV2:00, and TRV2:GhNRT2.1e plants. The values are means ± standard deviation (SD) of ten replicates. Student’s t-test was used to analyze the significance of differences. **P < 0.01 indicates significant differences between GhNRT2.1e-silenced plants and control plants. “WT” represents the wild type; “TRV2:00” represents the plants carrying control the TRV2 empty vector; “TRV2:GhNRT2.1e” represents the GhNRT2.1e-silenced plants; “CK” represents a nutrient solution with a nitrate concentration of 2.5 mM; “Low Nitrate” represents a nutrient solution with a nitrate concentration of 0.25 mM.

