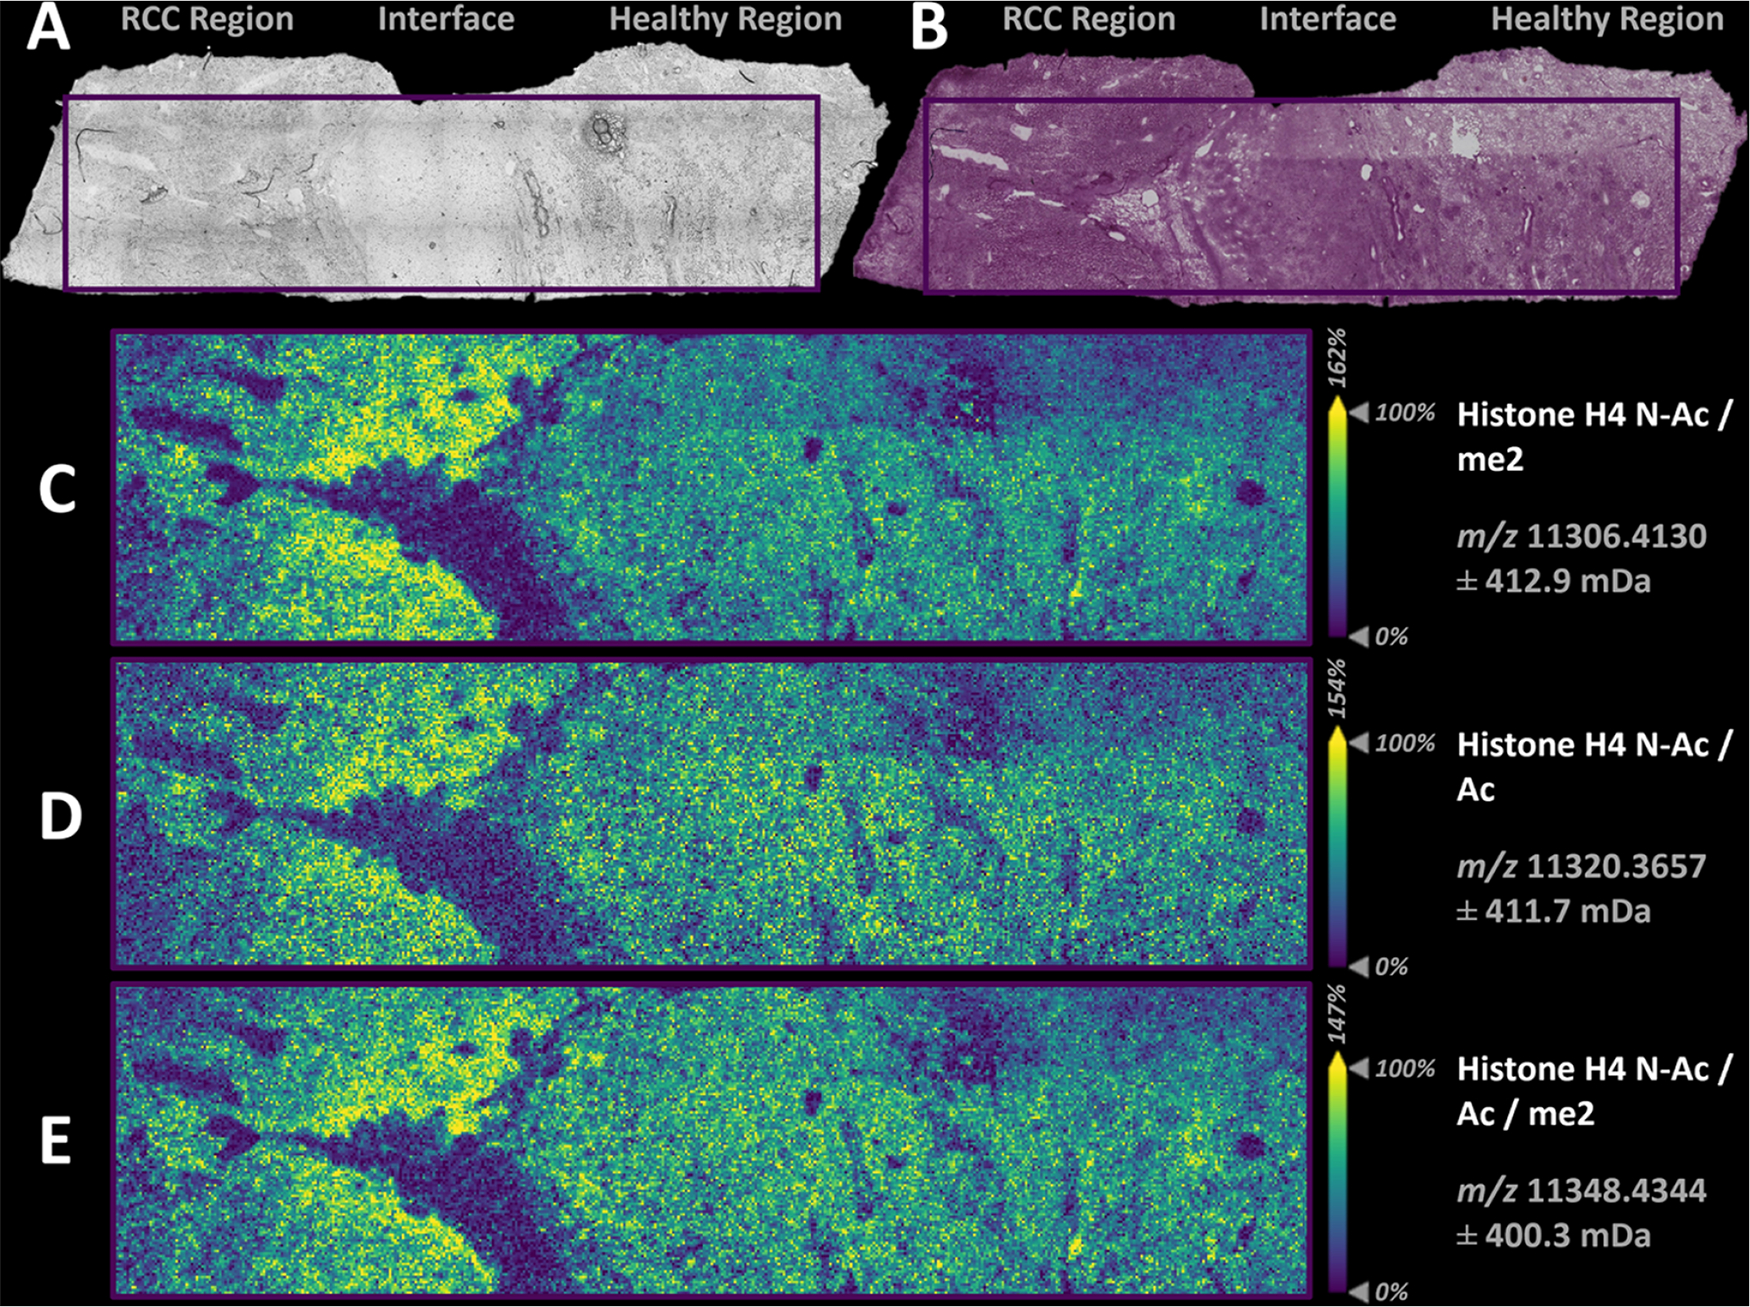
Figure 4.

(A) Bright microscopy image of the RCC section prior to MALDI-MSI analysis. (B) PAS-stained section post MALDI-MSI. Ion images are produced from singular isotopic peak distributions and show an expanded view of the MALDI-MSI analysis at 30 μm spatial resolution. Spatial distribution of (C) acetylated and dimethylated histone H4 proteoforms at m/z 11,306.4130 (0.57 ppm); (D) diacetylated histone H4 proteoform at m/z 11,320.3657 (0.42 ppm); and (E) diacetylated and dimethylated histone H4 proteoforms at m/z 11,348.4344 (1.78 ppm). Scale bars within the ion images are 600 μm, and each image has a separate ion intensity scale.
