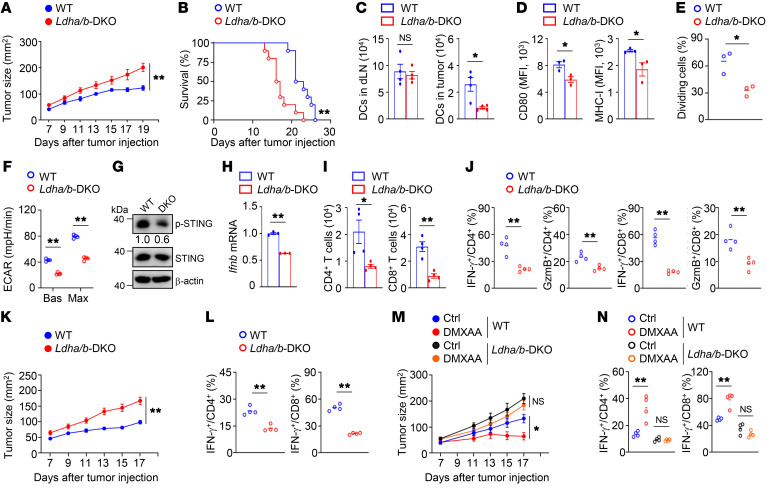
Figure 2. Blockade of glycolysis inhibits DC antitumor function.
(A and B) Tumor growth (n = 10; A) and survival curves (n = 10; B) of mice inoculated s.c. with MC38 cells. Representative data shown in A and B are from different experiments. (C) The numbers of DCs in the draining lymph nodes (dLN) and tumors of tumor-bearing mice on day 14 after tumor inoculation (n = 4). (D) Flow cytometry analysis of CD80 and MHC-I expression in tumor-infiltrating DCs from tumor-bearing mice (n = 3). (E) Flow cytometric analysis of the division of CTV-labeled OT-I T cells cocultured with tumor-infiltrating DCs (n = 3). (F) ECAR of tumor-infiltrating DCs from tumor-bearing mice (n = 4). (G) Immunoblot analysis of tumor-infiltrating DCs from tumor-bearing mice. The numbers indicate the relative densities of indicated protein bands normalized to β-actin. (H) qRT-PCR analysis of isolated tumor-infiltrating DCs from tumor-bearing mice. (I and J) Flow cytometry analysis of T cells from tumor-bearing mice on day 14. (K) Tumor growth of MC38 tumor-bearing WT mice transferred with cGAMP-stimulated BMDCs on day 3 after tumor injection (n = 9). (L) Flow cytometry analysis of tumor-infiltrating T cells of the mice from K. (M) Tumor growth of mice after i.p. injection with 500 μg DMXAA on day 7 after MC38 tumor injection (n = 7). Ctrl, without DMXAA injection. (N) Flow cytometry analysis of tumor-infiltrating T cells of the mice from M. Representative data are shown from 3 independent experiments. Data are shown as the mean ± SEM. Statistical analysis was performed using 2-way ANOVA (A, K, and M), log-rank (Mantel-Cox) test (B), 1-way ANOVA (N), and 2-tailed Student’s t test (C–F, H–J, and L); *P < 0.05; **P < 0.01.

