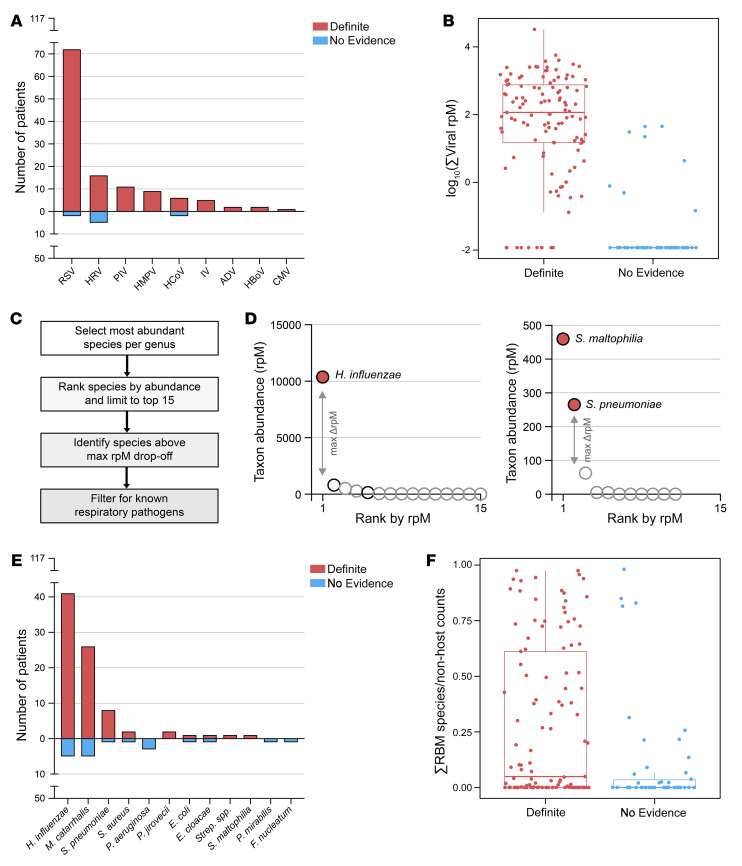
Figure 3. Metagenomic identification of respiratory pathogens.
(A) Bar plot showing the distribution of viruses detected by mNGS after background filtering in patients in the Definite and No Evidence groups. RSV, respiratory syncytial virus; HRV, human rhinovirus; PIV, parainfluenza virus; HMPV, human metapneumovirus; HCoV, human coronavirus; IV, influenza virus; ADV, adenovirus; HBoV, human bocavirus; CMV, cytomegalovirus. (B) Box plot showing the log10-transformed summed abundance, measured in reads-per-million (rpM), of all pathogenic viruses detected in each patient, separated by group. Prior to log10-transformation, the minimum non-zero rpM value in the data set was divided by 10 and added to all the samples. Horizontal lines denote the median, box hinges represent the interquartile range (IQR), and whiskers extend to the most extreme value no greater than 1.5 × IQR from the hinges. (C) Analysis steps applied as part of the rules-based model (RBM), a heuristic approach designed to identify potential bacterial/fungal pathogens in the context of LRTI. (D) Graphical illustration of the RBM results in two representative patients from the Definite group. Each dot represents a bacterial/fungal species most abundant in its respective genus. Species above the maximum drop-off in rpM are colored in red; otherwise, the color is white. Species on the list of known respiratory pathogens have black outlines; otherwise, the outline is gray. (E) Bar plot showing the distribution of bacteria/fungi called as potential pathogens by the RBM in patients in the Definite and No Evidence groups. Strep. spp., Streptococcus species other than S. pneumoniae. (F) Box plot showing the proportion of the RBM-identified pathogen(s) out of all nonhost counts in each patient, separated by group. Horizontal lines denote the median, box hinges represent the interquartile range (IQR), and whiskers extend to the most extreme value no greater than 1.5 × IQR from the hinges.

