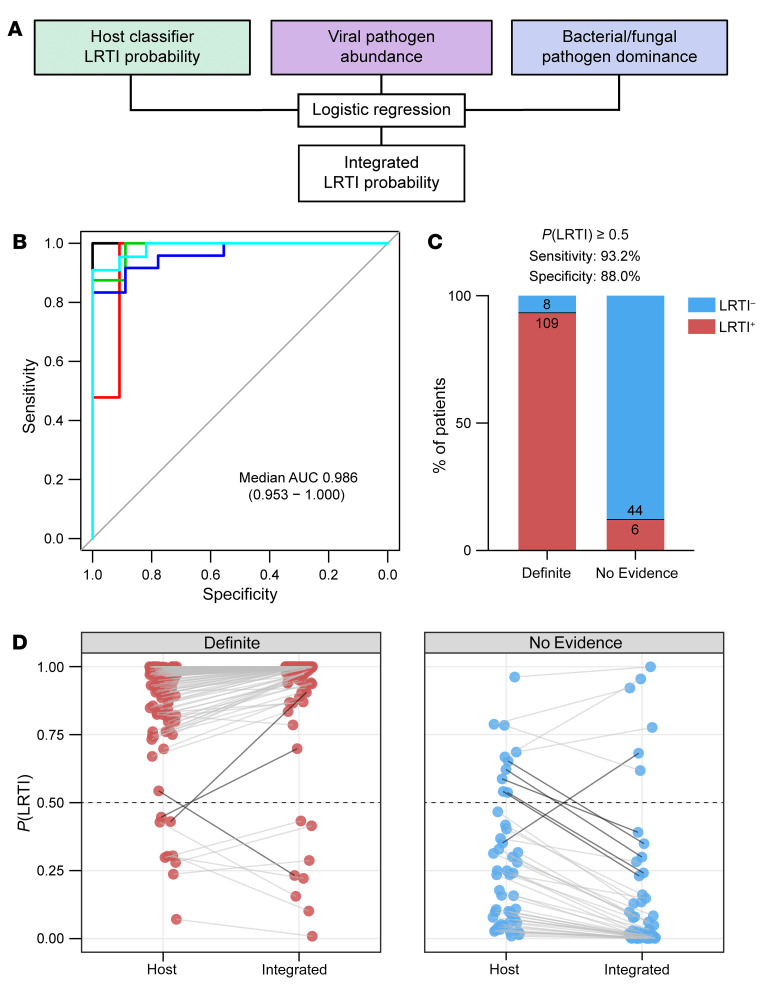
Figure 4. Integrated host/microbe classifier for LRTI diagnosis.
(A) Schematic of the integrated host/microbe classifier. (B) Receiver operating characteristic (ROC) curve of the integrated classifier in each of the test folds. The median and range of the area under the curve (AUC) are indicated. (C) Bar plot showing the number and percentage of patients in the Definite and No Evidence groups who were classified according to their clinical adjudication using a 50% out-of-fold probability threshold. (D) The shift in out-of-fold LRTI probability from the host classifier to the integrated classifier for patients in the Definite (left) and No Evidence (right) groups. Dark connecting lines highlight patients whose LRTI probability shifted across the 50% threshold.

