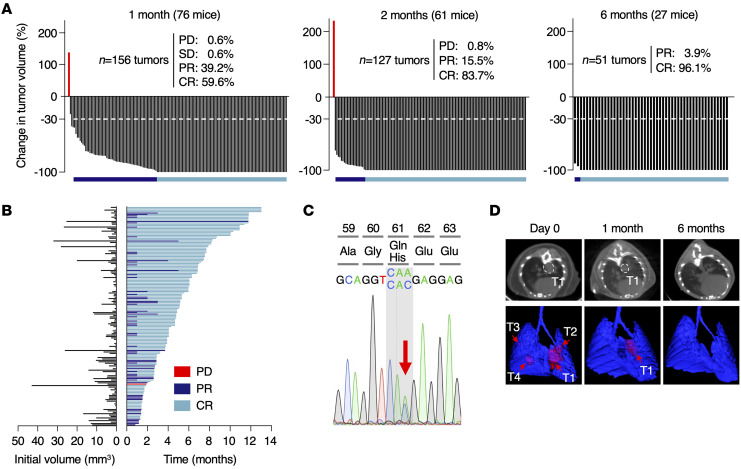
Figure 1. Genetic ablation of KrasG12V in KG12VloxPC2 lung tumors induces massive tumor regression.
(A) Waterfall plots representing the changes in tumor volume of tumors present in KG12VloxPC2 mice exposed to a TMX diet for 1 (n = 76 mice/156 tumors), 2 (n = 61 mice/127 tumors), and 6 months (n = 27 mice/51 tumors), as determined by CT scans. Percentages of tumors showing progressive (PD) or stable disease (SD), PR, or CR are depicted in the figure. A growing tumor lacking the resident KrasG12V oncogene is depicted in red. The dotted lines mark 30% regression levels. Horizontal bars indicate tumors undergoing PR (dark blue) and CR (light blue). (B) Initial tumor size (left) and duration of response (right) from individual tumors represented in A until they reach a humane end point. Colors are those described in A. (C) Sequencing chromatogram depicting the Q61H mutation in the WT Kras allele present in the single tumor that displayed PD after KrasG12V ablation. The arrow indicates the WT (CAA) and mutated (CAC) codons. (D) Representative images illustrating CT scans (top) and 3D rendering (bottom) of lungs depicting tumor response after 1 and 6 months of TMX exposure. Tumors are outlined (top) or indicated by arrows (bottom). T1, tumor 1.

