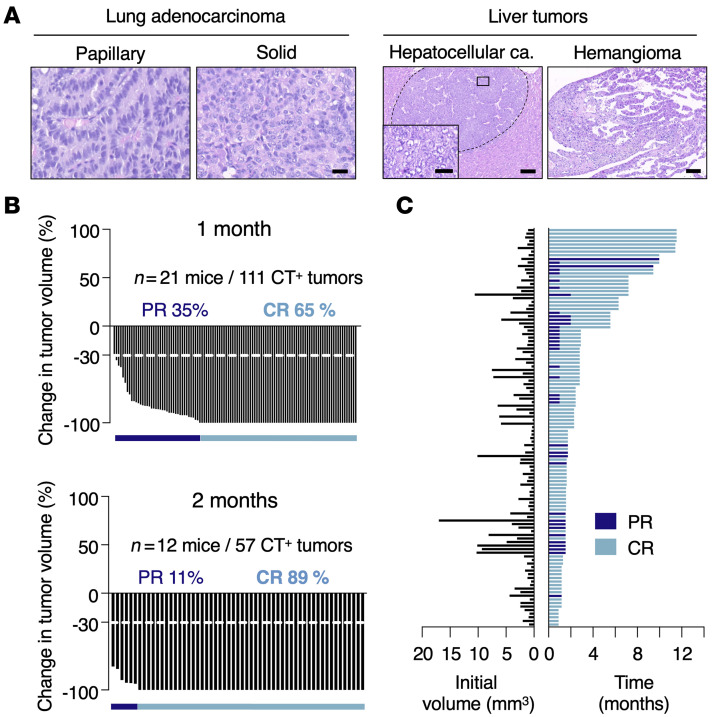
Figure 2. Effect of Kras ablation in urethane-induced lung tumors.
(A) Representative images of H&E-stained, paraffin-embedded sections of LUADs with papillary or solid structure (left) and of liver tumors including a hepatocellular carcinoma and a hemangioma (right) present in KloxPC2 mice exposed to urethane. Scale bars: 100 μm (low magnification); 20 μm (high magnification). (B) Waterfall plots representing changes in tumor volume in KloxPC2 mice exposed to a TMX diet for 1 month (n = 21 mice/111 tumors) (top) or 2 months (n = 12 mice/57 tumors) (bottom). Percentages of tumors undergoing PR (dark blue bar) or CR (light blue bar) are depicted in the figure. (C) Initial tumor size (left) and duration of response (right) from individual tumors represented in B. Colors indicate whether individual tumors underwent PR (dark blue) or CR (light blue) up to the time of the humane end point.

