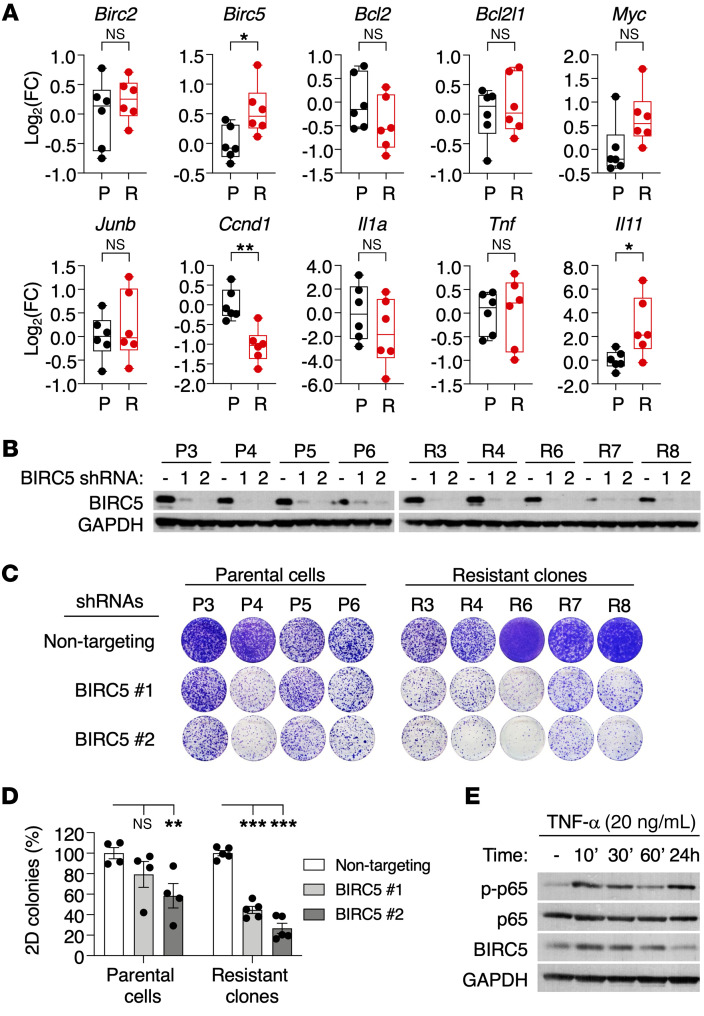
Figure 5. BIRC5 is required for survival of resistant Kras+/–;Trp53–/– clones.
(A) Shown are log2 fold change (FC) values determined by quantitative reverse-transcriptase PCR (qRT-PCR) for NF-κB target genes in parental Kras+/G12Vlox;Trp53–/– cells (P, black, n = 6) and resistant Kras+/–;Trp53–/– clones (R, red, n = 6). β-Actin was used for normalization. P values were calculated using unpaired Student’s t test. *P < 0.05; **P < 0.01. (B) Western blot analysis of BIRC5 expression in lysates from parental Kras+/G12Vlox;Trp53–/– cell lines (P3 to P6) and resistant Kras+/–;Trp53–/– clones (R3 to R8) after expression of 2 independent shRNAs. GAPDH served as loading control. (C) Colony-formation assays on 10 cm cell culture dishes of parental Kras+/G12Vlox;Trp53–/– cell lines and resistant Kras+/–;Trp53–/– clones expressing either nontargeting shRNA or 2 independent shRNAs against BIRC5. (D) Quantification of the number of colonies present in the experiment described in C. Data are represented as mean ± SEM. P values were calculated using 2-way ANOVA. **P < 0.01; ***P < 0.001. (E) Western blot analysis of p-p65, p65, and BIRC5 expression in lysates from a parental Kras+/G12Vlox;Trp53–/– cell line treated with TNF-α (20 ng/ml) for the indicated time points. GAPDH served as loading control.

