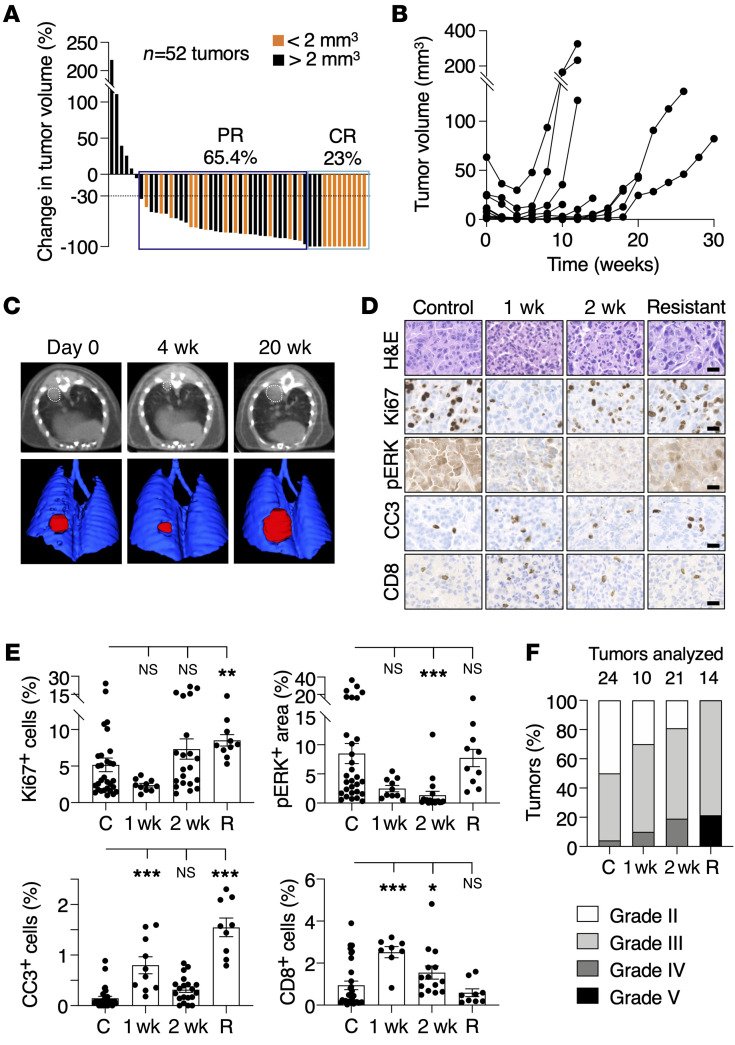
Figure 6. Tumor response to sotorasib treatment in KG12CP mice.
(A) Waterfall plot representing the changes in tumor volumes of individual lung tumors present in Kras+/FSFG12C;Trp53F/F (KG12CP) mice treated with sotorasib for 1 month (n = 15 mice/52 tumors). Tumors whose volume at the time of the first CT were smaller (orange) or larger (black bars) than 2 mm3 are indicated. (B) Tumor volumes determined by CT scans of representative tumors in KG12CP mice treated with sotorasib for the indicated times. (C) CT scans (top) and 3D rendering (bottom) of lungs of KG12CP mice at the beginning (day 0) and after sotorasib treatment for 4 and 20 weeks (w). Visible lesions are outlined by dotted lines (above) and in red (bottom). (D) Representative images of H&E, Ki67, pERK, cleaved caspase-3 (CC3), and CD8 staining in paraffin-embedded sections of tumors from KG12CP mice either untreated (Control), treated with sotorasib for 1 or 2 weeks, and after they became resistant to sotorasib (Resistant). Scale bars: 20 μm. (E) Quantification of the percentages of Ki67+, CC3+, and CD8+ cells and pERK+ areas in sections of tumors from KG12CP mice either untreated (C) or treated with sotorasib for 1 or 2 weeks, and after they became resistant to sotorasib (R). Data are represented as mean ± SEM. P values were calculated using 1-way ANOVA. *P < 0.05; **P < 0.01; ***P < 0.001. (F) Percentages of the different histological grades (II to V) displayed by lung tumors in KG12CP mice. Different shades of gray indicate increasing grades. Tumors present in KG12CP mice untreated, treated with sotorasib for 1 or 2 weeks, and after they became resistant to sotorasib are indicated.

