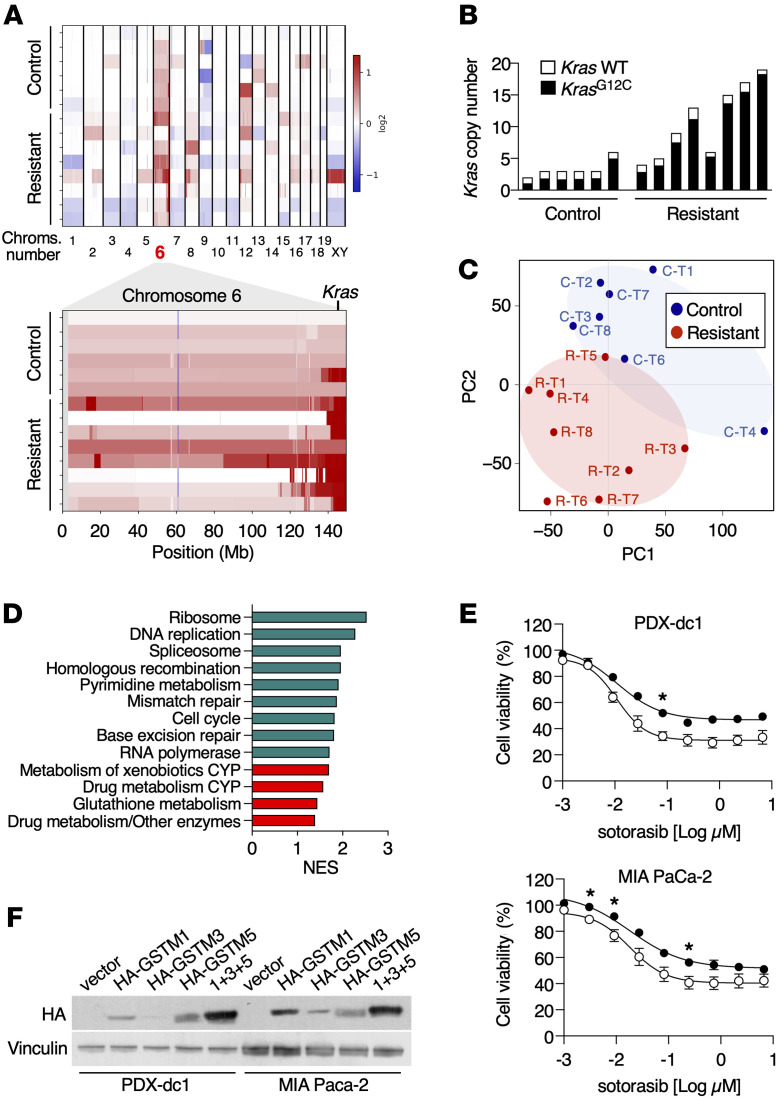
Figure 7. Genomic and transcriptomic analysis of sotorasib-resistant tumors.
(A) Heatmaps representing log2 ratio copy number variations (CNVs) from WES data of control and sotorasib-resistant tumors in all chromosomes (top) and in chromosome 6 (bottom). Each row represents an individual sample. Copy number gains are represented in shades of red, while copy number losses are depicted in shades of blue. The position of Kras on chromosome 6 is indicated. (B) Absolute copy numbers of WT Kras (white bars) as well as KrasG12C alleles (black bars) from control and sotorasib-resistant tumors. Data were obtained from WES analyses. (C) Principal component analysis (PCA) displaying the distribution of control tumors (blue) and sotorasib-resistant tumors (red). (D) Normalized enrichment scores of biological pathways significantly enriched in sotorasib-resistant tumors obtained from GSEA of KEGG gene sets. Proliferation-related pathways are represented in green and drug metabolism-related pathways in red. Only gene sets significantly enriched at FDR q values < 0.25 were considered. (E) Relative viability of PDX-dc1 and MIA PaCa-2 cells infected with empty lentiviral vectors or lentiviral vectors (white circles, n = 3 for MIA PaCa-2 cells, n = 2 for PDX-dc-1 cells)expressing GSTM1, GSTM3, and GSTM5 proteins (black circles, n = 3 for MIA PaCa-2 cells, n = 2 for PDX-dc-1 cells) after treatment with the indicated doses of sotorasib for 72 hours. P values were calculated using unpaired Student’s t test. *P < 0.05. (F) Western blot analysis of PDX-dc1 and MIA PaCa-2 cells infected with empty lentiviral vectors or lentiviral vectors expressing HA-GSTM1, HA-GSTM3, and/or HA-GSTM5 proteins using anti-HA antibodies. Vinculin expression served as a loading control.

