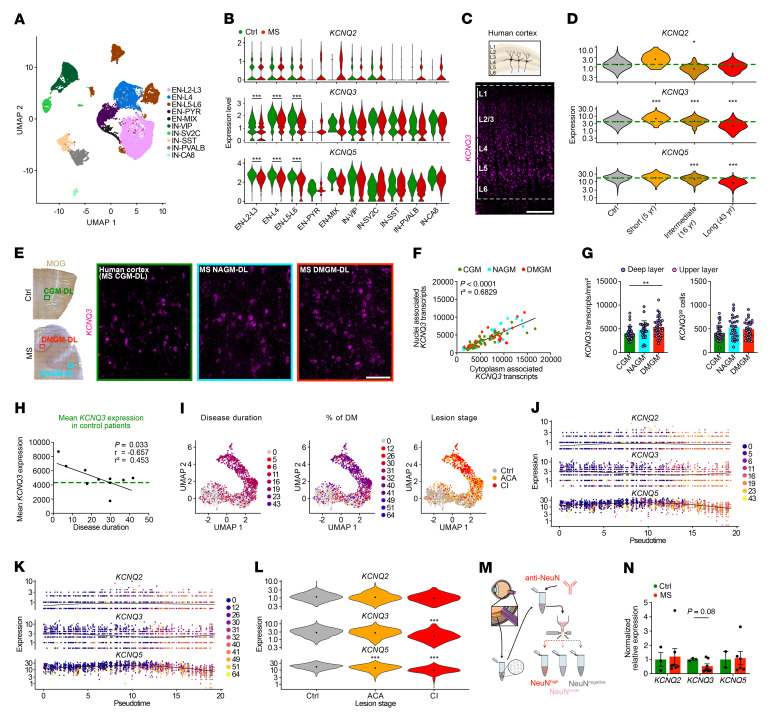
Figure 2. KCNQ3 dysregulation in cortical and retinal MS tissues.
(A) Uniform manifold approximation and projection (UMAP) plot visualizes clustering of human excitatory (EN) and inhibitory (IN) cortical neurons based on a published snRNA-Seq data set (12). (B) Normalized KCNQ2/-3/-5 expression in control (Ctrl) and MS human cortical neurons. (C) Spatial KCNQ3 expression (ISH) in the human cortex. (D) Violin plots visualize average KCNQ2/-3/-5 expression levels (snRNA-Seq, A) in control neurons (n = 5; green dashed line) and representative MS samples from patients with various disease durations. (E) KCNQ3 ISH in human CGM and MS NAGM and DMGM lesion areas based on MOG IR. DL, deep layers. (F) Correlation of nucleus- and cytoplasm-associated KCNQ3 transcript counts within the same cell in human cortical tissues (ISH) from CGM (n = 35 areas, n = 5 patients), NAGM (n = 27 areas, n = 8 patients) and DMGM (n = 34 areas, n = 8 patients). (G) KCNQ3 upregulation in DMGM (ISH) independent of neuronal density. (H) Gradual loss of mean KCNQ3 expression in MS GM tissues (ISH) from patients with a prolonged MS disease duration approached CGM expression levels (n = 5, green dashed line). (I) Unsupervised trajectory inference of upper L2/-3 neuron branch and nuclei distribution along the trajectory (compare with Supplemental Figure 3, E and F) based on MS disease duration, demyelination (DM) extent, and lesion stage. (J and K) Pseudotime-dependent KCNQ2/-3/-5 expression in relation to disease duration and demyelination based on MOG IR. (L) Neuronal KCNQ2/-3/-5 expression grouped by lesion stage. (M) Sorting of retinal nuclei based on NeuN IR. (N) Normalized KCNQ2/-3/-5 expression by qPCR in human RGC nuclei (controls, n = 6; MS, n = 7). Scale bars: 500 μm (C); 100 μm (E). *P < 0.05, **P < 0.01, ***P < 0.001, by Wilcoxon rank-sum test with Bonferroni’s correction (B); generalized linear model by Wald test with Benjamini and Hochberg correction (D and L); simple linear regression (F and H); Kruskal-Wallis test (G); and mixed-effects model with Geisser-Greenhouse correction and Šidák’s multiple-comparison test (N). ACA, acute chronic active; CI, chronic inactive.

