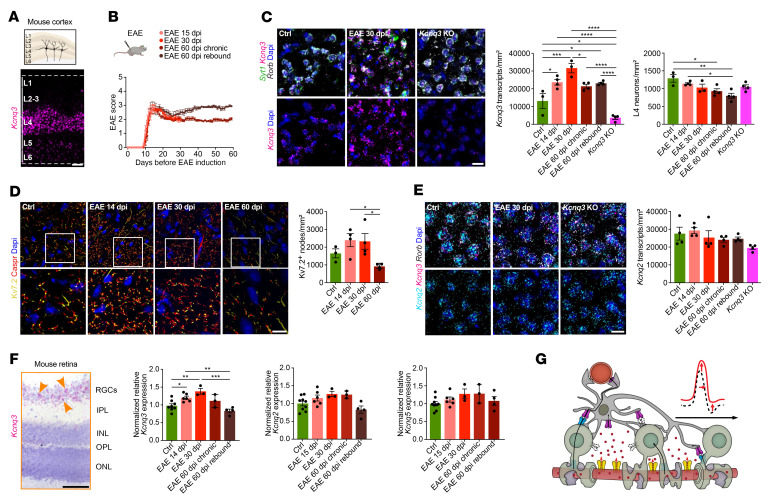
Figure 3. Dysregulation of Kv7 subunits in cortical and retinal EAE tissues.
(A) Spatial Kcnq3 expression (ISH) in the mouse cortex. (B) Overview plot visualizes different EAE groups including endpoints at 15, 30, and 60 dpi; note chronic EAE groups (endpoint at 60 dpi) were divided into 2 groups separating animals with or without clinical worsening (rebound). (C) Kcnq3 expression (ISH) in Syt1+ Rorb+ L4 mouse neurons at 14, 30, and 60 dpi in EAE (each, n = 4) and control (n = 3) mice; Kcnq3-KO mouse tissue showed a strong reduction in Kcnq3 expression (n = 4). (D) Density of Kv7.2+ nodes (framed by Caspr+ IR) based on IR in L4 cortical areas at 14, 30, and 60 dpi in EAE (each, n = 4) and control (n = 3) tissues. (E) Kcnq2 expression based on ISH in L4 mouse neurons at 14, 30, and 60 dpi in EAE, control, and Kcnq3-KO (each, n = 4) mice. (F) Kcnq3 expression (ISH) of mouse retinal specimens comprising the inner plexiform layer (IPL), inner nuclear layer (INL), outer plexiform layer (OPL), and outer nuclear layer (ONL) revealed specific Kcnq3 expression in RGCs (yellow arrows). Plots show normalized Kcnq2/-3/-5 expression (qPCR) in sorted mouse NeuNhi RGC nuclei (control, n = 9; 15 dpi, n = 6; 30 dpi, n = 3; 60 dpi chronic, n = 3; 60 dpi rebound, n = 4). (G) Cartoon illustrates dysregulated neuron-OL K+ shuttling during inflammatory demyelination resulting in neuronal hyperexcitability, axonal swelling, and impaired neuronal function in addition to OL-Kir4.1 loss (colorless channels with dashed borders) and transient upregulation of nodal Kv7 channels. Scale bars: 100 μm (A and F); 20 μm (C–E). Original magnification, ×63 (enlarged insets in D). *P < 0.05, **P < 0.01, ***P < 0.001, and ****P < 0.0001, by 1-way ANOVA (C–F).

