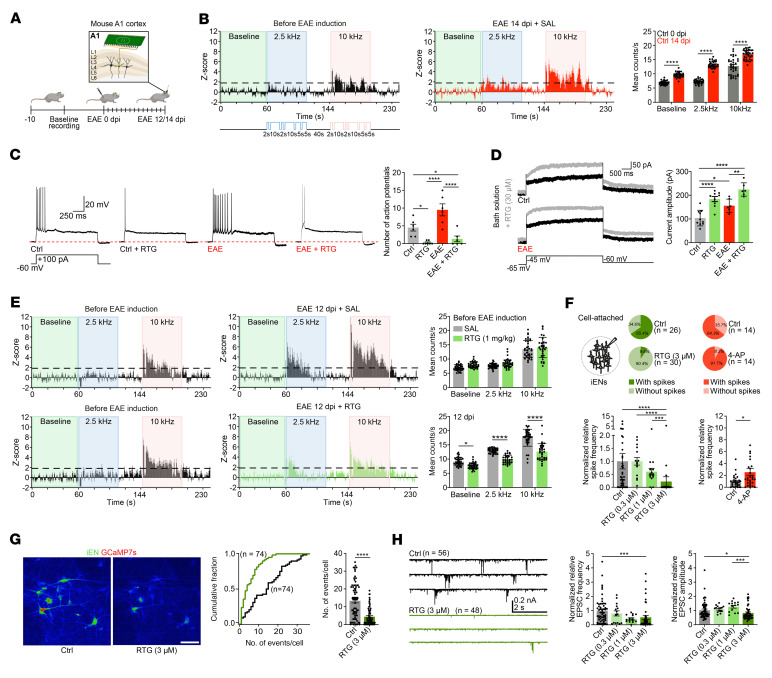
Figure 4. Altered neuronal excitability and network activity in EAE.
(A) Cartoon illustrates in vivo recordings from mouse A1. (B) Z score analysis of mouse auditory neurons before EAE induction demonstrated a tonotopic organization of the auditory cortex with a neuronal response to 10 kHz (pink insets) but not 2.5 kHz (blue insets) tones relative to baseline (green insets). EAE induction augmented overall neuronal activity and disrupted tonotopic organization (increased neuronal response to 2.5 kHz) (each, n = 34). (C and D) RTG (30 μM) reduced neuronal excitability (C) and increased M-currents (D) in control (C, untreated, n = 6; RTG, n = 7; D, untreated, n = 10; RTG, n = 9) and 12 dpi EAE (each n = 6) mouse brain sections. (E) Continuous RTG treatment (1 mg/kg) starting at baseline prevented an EAE-associated increase in neuronal excitability at 12 dpi (lower panel, right) resulting in similar z scores before EAE induction (left panels) (each, n = 34). (F) RTG (0.3 μM, n = 15; 1 μM, n = 15; 3 μM, n = 30) reduced normalized relative iEN firing in a dose-dependent manner compared with untreated iENs (n = 41). Kv channel blocker 4-AP increased spontaneous firing (each, n = 29). (G) GCaMP7s reporter iENs showed reduced spontaneous calcium transients in response to RTG (3 μM; each, n = 74). (H) Representative EPSC traces revealed reduced normalized relative EPSC frequency and amplitudes (0.3 μM, n = 15; 1 μM, n = 14 [amplitude], 15 [frequency]; 3 μM, n = 48) of RTG-treated iENs in a dose-dependent manner compared with controls (frequency. n = 56; amplitude. n = 55). Scale bar: 80 μm (G). *P < 0.05, **P < 0.01, ***P < 0.001, and ****P < 0.0001, by 2-way ANOVA (B); 1-way ANOVA (C and D); multiple unpaired t tests (E); Kruskal-Wallis (left) and Mann-Whitney U (right) tests (F); 2-way ANOVA (left) and Mann-Whitney U (right) (G); and Kruskal-Wallis test (H).

