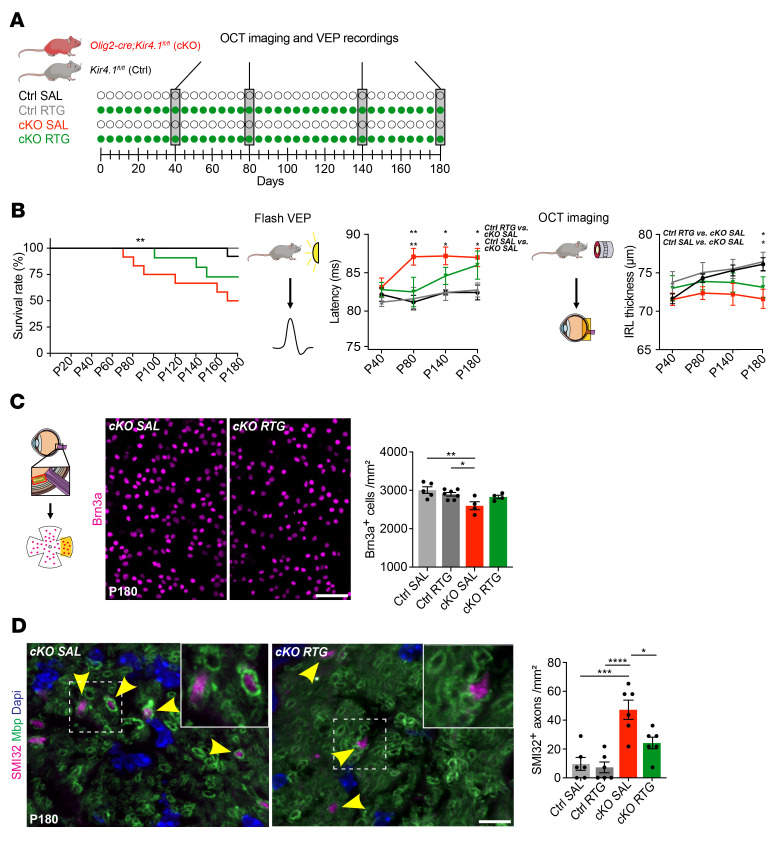
Figure 6. Effects of chronic RTG treatment in OL-Kcnj10–deficient mice.
(A) Scheme of continuous RTG versus SAL treatment in OL-Kcnj10–KO mice versus controls. (B) Chronic RTG treatment increased survival in both control (SAL, n = 13; RTG, n = 12) and OL-Kcnj10–KO (SAL, n = 12; RTG, n = 11) animals at P180. Delayed VEP latencies in SAL-treated but not RTG-treated (both n = 5) OL-Kcnj10–KO mice versus SAL-treated (n = 9) and RTG-treated (n = 8) mice at P80. Note the delayed VEP latencies with aging in both SAL- and RTG-treated KO groups at P140 and P180. IRLs showed physiological growth during aging in both SAL- and RTG-treated (both, n = 8) control mice and RTG-treated but not SAL-treated (both n = 5) OL-Kcnj10–KO animals until P140. At P180, IRL thinning occurred only in SAL-treated but not RTG-treated KO mice. (C) Chronic RTG treatment (n = 4) prevented loss of Brn3a+ RGCs in SAL-treated (n = 5) OL-Kcnj10–KO mice compared with SAL-treated (n = 5) and RTG-treated (n = 7) controls. (D) RTG treatment prevented increased counts of dystrophic/damaged SMI32+ axons in the ON, as seen in SAL-treated OL-Kcnj10–KO mice compared with controls (n = 6 for each group). Yellow arrowheads indicate SMI32+ (dystrophic) axons sheathed by Mbp+ myelin. Scale bars: 20 μm (C); 10 μm (D). Original magnification, ×63 (enlarged insets in D). *P < 0.05, **P < 0.01, ***P < 0.001, and ****P < 0.0001, by Mantel-Cox (left), 2-way ANOVA (right, VEP and OCT) (B); 1-way ANOVA (C and D).

