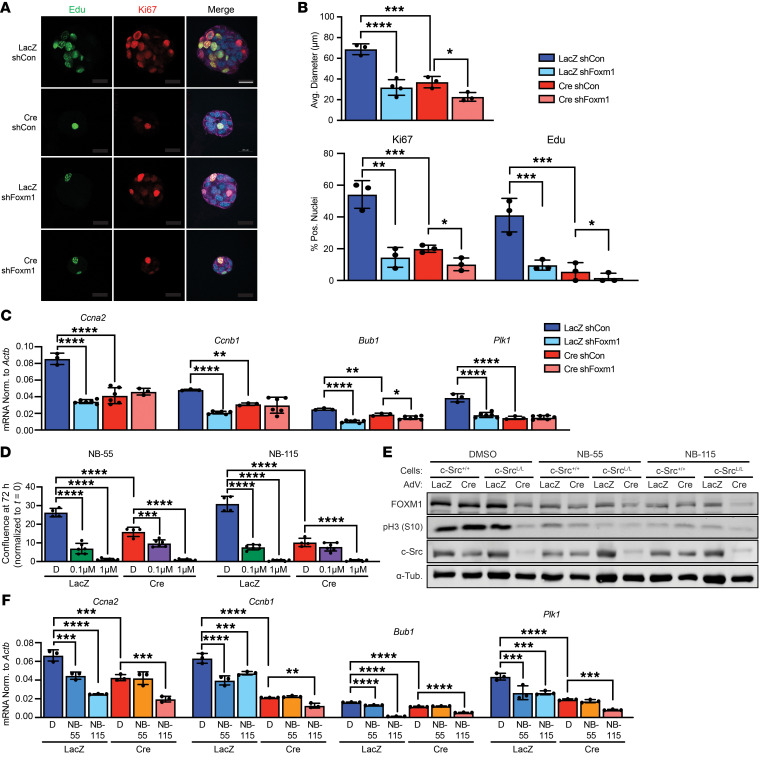
Figure 6. FOXM1 inhibition blocks the proliferation of luminal B breast cancer cells.
(A and B) MT/c-SrcL/L cells were grown as 3D spheroids and immunostained to detect Ki67 expression and EdU incorporation. (A) Images are representative of 2 cell lines. Scale bar: 20 μm. (B) Quantification of spheroid size and Ki67 and EdU staining, normalized to total nuclei. Pos., positive. *P < 0.05, **P < 0.01, ***P < 0.001, and ****P < 0.0001, by 1-way ANOVA with Tukey’s post hoc test. (C) qRT-PCR analysis of FOXM1 target gene expression in MT/c-SrcL/L cells transduced with the indicated shRNAs and adenoviruses. FOXM1 target expression was normalized (Norm.) to that of Actb. Data show the mean of experiments performed in 2 different cell lines in triplicate. *P < 0.05, **P < 0.01, and ****P < 0.0001, by 1-way ANOVA with Tukey’s post hoc test. (D) Cells, as in C, were treated with FOXM1 inhibitors (NB-55 and NB-155) at the indicated concentrations or with DMSO, and proliferation was assayed using an imaging-based assay. n = 2 cell lines in triplicate. ***P < 0.001 and ****P < 0.0001, by 1-way ANOVA with Tukey’s post hoc test. (E) Lysates of cells, as in D, were immunoblotted with the indicated antibodies. FOXM1 inhibitors were used at 1 μM. α-Tub., α-Tubulin. (F) qRT-PCR analysis of FOXM1 target gene expression in cells as in D and E treated with DMSO (D) or FOXM1 inhibitors (NB-55 and NB-115) at 1 μM. Data indicate the mean of experiments performed in 2 different cell lines in triplicate. **P < 0.01, ***P < 0.001, and ****P < 0.0001, by 1-way ANOVA with Tukey’s post hoc test.

