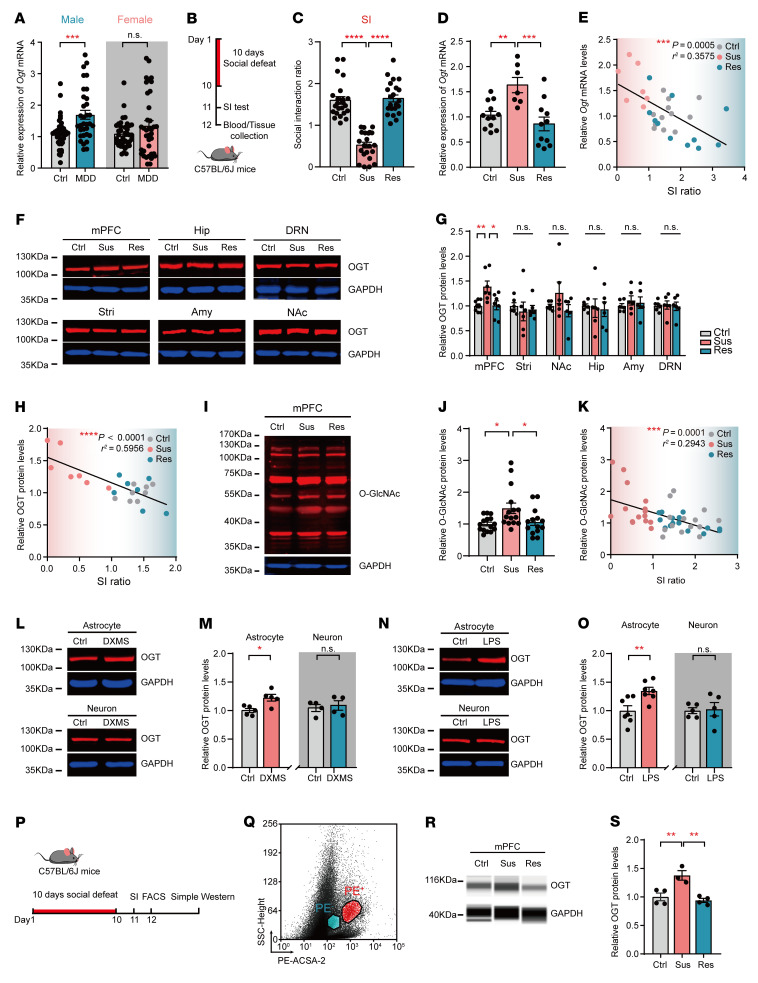
Figure 1. Astrocytic OGT is increased in the mPFC after CSDS.
(A) Ogt mRNA levels in peripheral blood from MDD patients and healthy controls by sex. MDD patients (33 males and 37 females); healthy control subjects (38 males and 39 females). (B) Paradigms of 10 days of CSDS and SI tests. (C) C57BL/6J mice were divided into the Sus and Res subgroups according to the SI ratio after CSDS. n = 23 (control [Ctrl]); n = 22 (Sus); n = 22 (Res). (D) Ogt mRNA expression in blood from C57BL/6J mice after CSDS. (E) Relationship between Ogt levels and SI ratio, P = 0.0005. n = 12 (control); n = 7 (Sus); n = 11 (Res). (F and G) OGT protein levels in mood-related brain regions. n = 8 (Ctrl); n = 7 (Sus); n = 7 (Res) mice in the mPFC; n = 6 mice in the Stri, NAc, Hip, Amy, and DRN. (H) Relationship between OGT protein levels in the mPFC and SI, P < 0.0001. n = 8 (Ctrl); n = 7 (Sus); n = 7 (Res). (I and J) Protein O-GlcNAc levels in the mPFC after CSDS. n = 15 (Ctrl); n = 15 (Sus); n = 14 (Res) mice. (K) Pearson’s correlation analysis between total O-GlcNAc expression and SI, P = 0.0001. n = 15 (Ctrl); n = 15 (Sus); n = 14 (Res). (L and M) OGT protein expression in primary cultured astrocytes and neurons treated with DXMS. n = 5 in astrocytes; n = 4 in neurons. (N and O) OGT protein expression in primary cultured astrocytes and neurons treated with LPS. n = 7 in astrocytes; n = 5 in neurons. (P and Q) Analysis of astrocytes sorted by FACS in the mPFC following CSDS. (R and S) Astrocytic OGT expression in the mPFC after CSDS. n = 4 (Ctrl); n = 3 (Sus); n = 4 (Res) trials involving 6–8 mice each. Data are represented as mean ± SEM. Two-sided unpaired t test (M and O) or Mann-Whitney U test (A) for 2 groups; 1-way ANOVA followed by Bonferroni’s test for multiple comparisons (C, D, G, J, and S). *P < 0.05; **P < 0.01; ***P < 0.001; ****P < 0.0001. See Supplemental Data Set 1 for statistical details.

