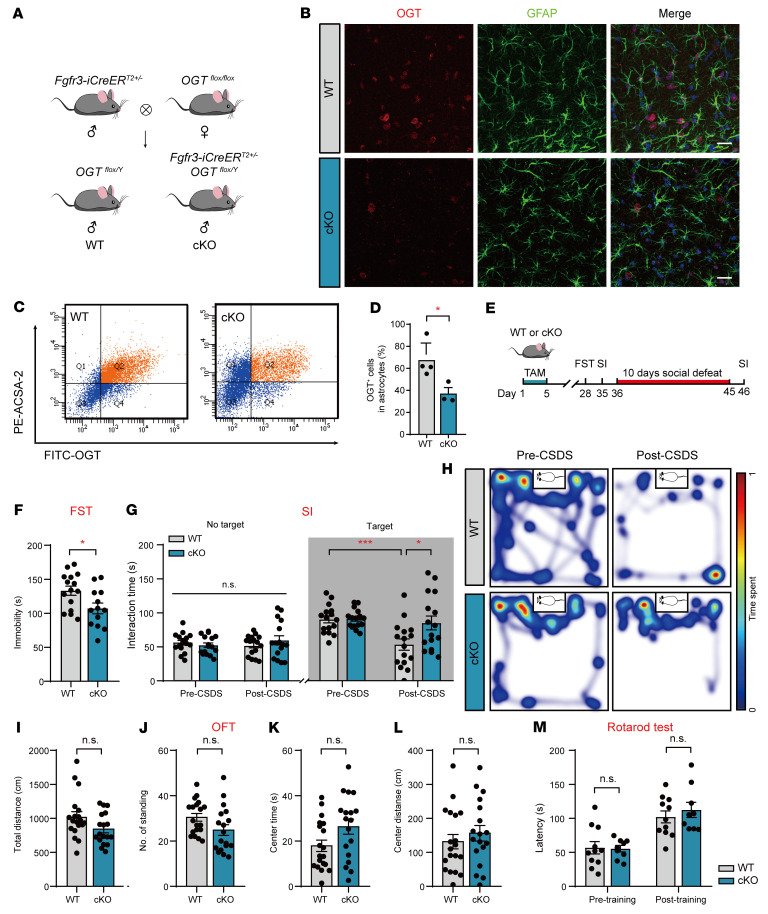
Figure 2. Deletion of astrocytic OGT results in antidepressant-like effects.
(A) Generation of OGT-cKO mice by crossing OGTfl/fl lines with Fgfr3-iCreERT2 lines. (B) Double-immunofluorescence staining of OGT (red) with GFAP (green) in cKO and WT mice. Scale bars: 20 μm. (C and D) FACS images and quantification of OGT-positive astrocytes from cKO and WT mice. n = 4 (WT); n = 3 (cKO) mice. (E) Paradigms of behavioral analysis of cKO mice and littermate controls using the FST and CSDS. (F) Immobility time of cKO and WT mice in the FST. n = 15 (WT); n = 13 (cKO) mice. (G and H) SI time in the absence or presence of a social target (G). n = 16 (WT); n = 16 (cKO) mice. Representative heatmaps (H) of WT (top) and cKO (bottom) mice in the presence of social targets before CSDS (left) and after CSDS (right). (I–L) OFT of Fgfr3-iCreERT2; OGTfl/Y (cKO) and WT mice. n = 19 (WT); n = 18 (cKO). (M) Rotarod test of cKO and WT mice. n = 15 (WT); n = 13 (cKO) mice. Data are represented as mean ± SEM. Two-sided unpaired t test (D, F, and I–L); 2-way ANOVA with Bonferroni’s multiple-comparisons test (G and M). *P < 0.05; ***P < 0.001. See Supplemental Data Set 1 for statistical details.

