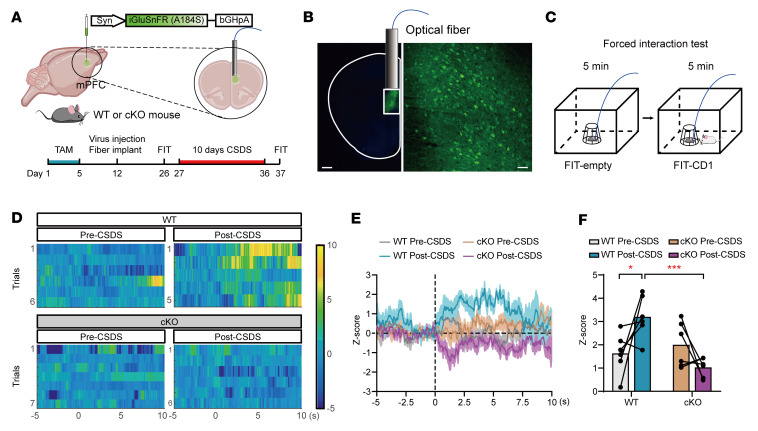
Figure 8. Astrocytic OGT regulates glutamate signaling via the O-GlcNAcylation of GLT-1.
(A and B) Schematic of the AAV vectors engineered to express the glutamate sensor (iGluSnFR A184S) under a syn promoter (A) and representative images of the injection sites in the mPFC (B). Scale bars: 500 μm (right, magnified view of the left image); 50 μm (left). (C) Paradigms of the FIT. (D) Representative heatmaps of z score changes over all trials in single mice. (E and F) Time course of average iGluSnFR transient z scores event locked to SI (E) and quantification of the average peak z score during SI (F). n = 6 (WT); n = 6 (cKO) mice. Data are represented as mean ± SEM. Two-way ANOVA with Bonferroni’s multiple-comparisons test (F). *P < 0.05; ***P < 0.001. See Supplemental Data Set 1 for the statistical details.

