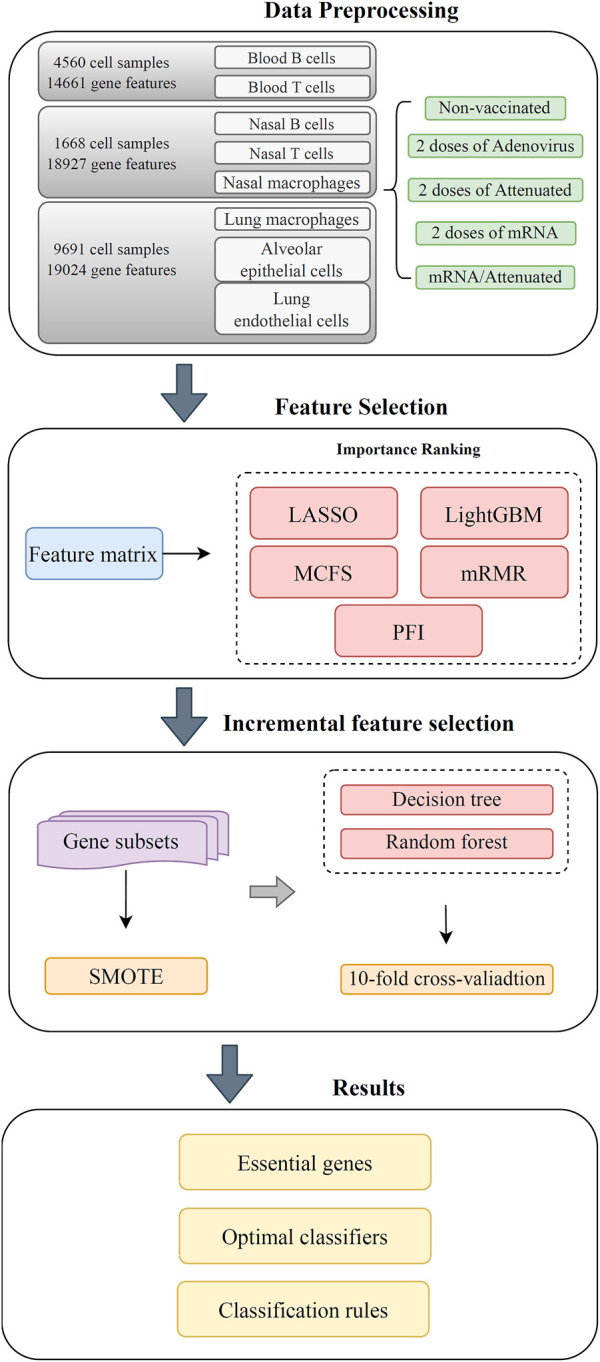
FIGURE 1.

Flow chart of the entire computational analysis. Gene expression profiling data of SARS-CoV-2 infection in hamster were analyzed using a machine learning based approach with samples from blood T cells, blood B cells, nasal T cells, nasal B cells, lung macrophages, nasal macrophages, alveolar epithelial cells, and lung endothelial cells. Each cell has five vaccination states, that is, unvaccinated, two doses of adenovirus vaccine, two doses of attenuated virus vaccine, two doses of mRNA vaccine, and one dose of mRNA followed by one dose of attenuated vaccine. Gene features were analyzed by five feature selection methods, namely, LASSO, LightGBM, MCFS, mRMR, and PFI. The resulting feature lists were fed into the incremental feature selection (IFS) method to extract the underlying genes, construct effective classifiers and classification rules.
