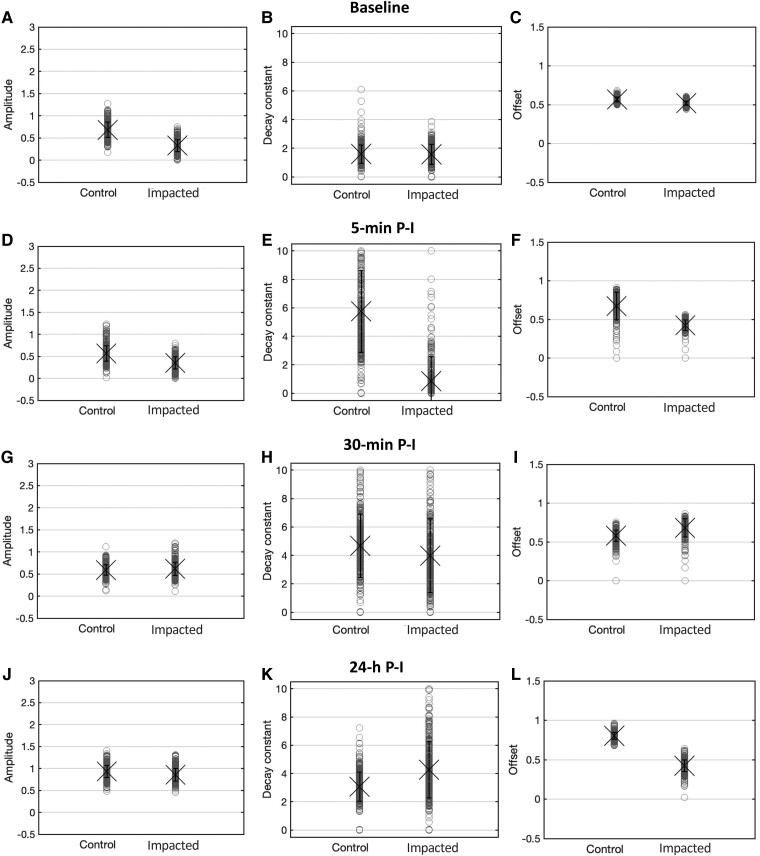
Figure 3.
Population-level habituation descriptives. Descriptive statistics of the mean (±1 SE) amplitude (A, D, G, J), decay constant (B, E, H, K) and offset (C, F, I, L) of 500 bootstraps of locomotor distance travelled over the 20 visual stimuli—fitted to a single exponential—for the control and impacted groups, at baseline, 5-min, 30-min, 60-min and 24-h P-I.

