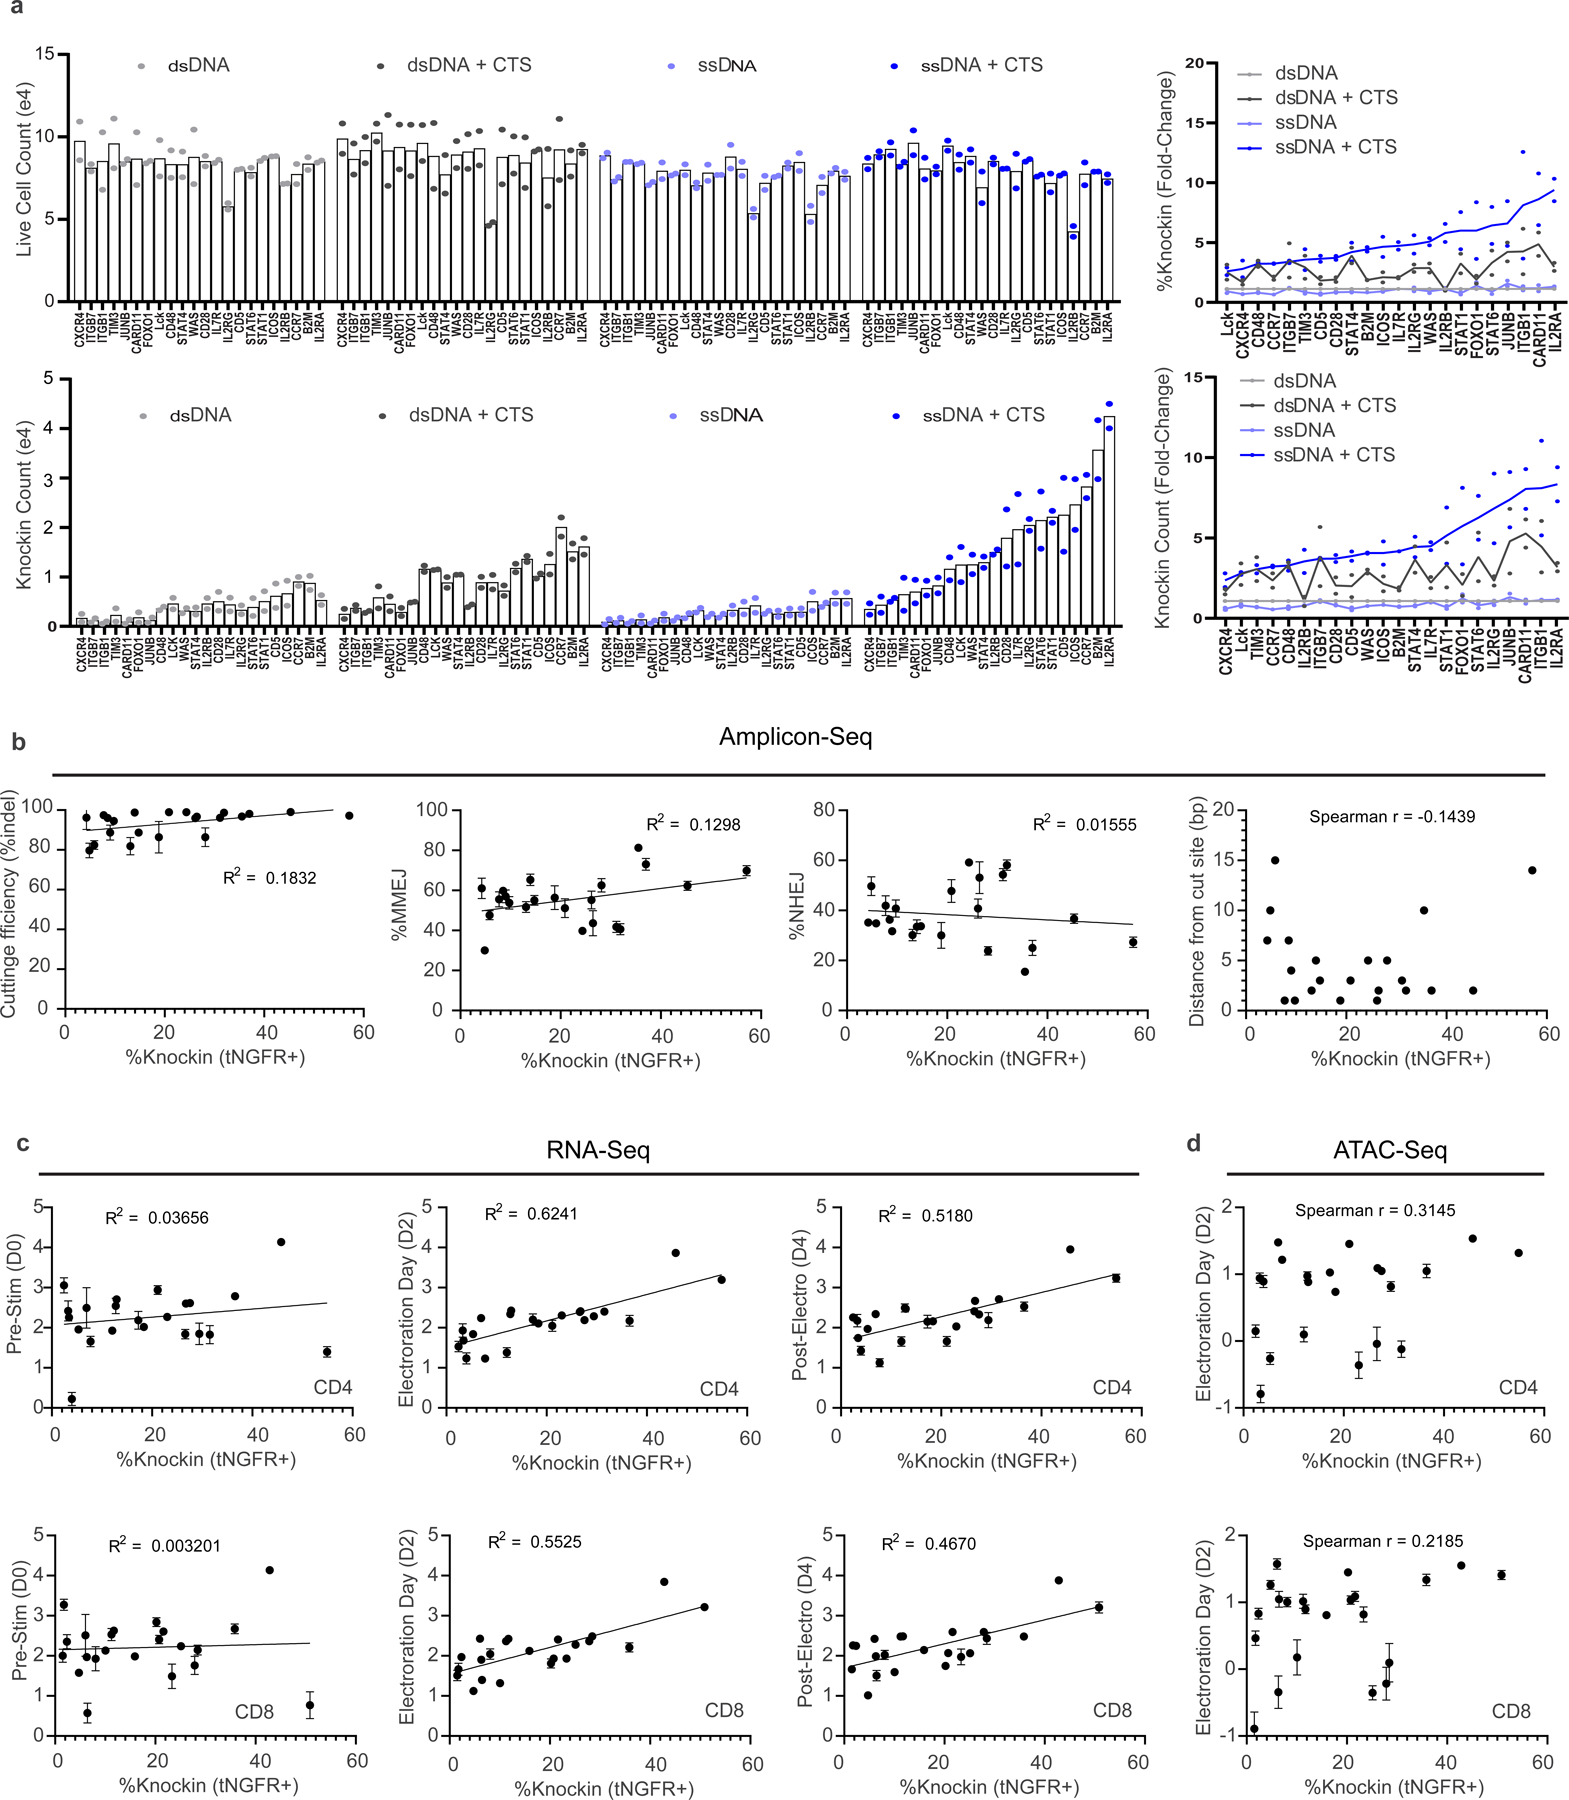
Extended Data Fig. 5 |. Arrayed knockin analysis and target locus characteristics.

(a) Comparison of HDRT variations for knock-in constructs targeting a tNGFR marker across 22 different target loci. Shown for each construct are live cell counts, knock-in cell count yields, relative %knock-in and relative knock-in counts compared to dsDNA templates. Data show mean and individual values from 2 independent healthy human blood donors (b-d) Evaluation target locus characteristics in comparison to ssCTS knockin efficiency by (b) Amplicon-Seq, (c) RNA-Seq, and (d) ATAC-Seq methodologies. Knock-in efficiency for panels b-d shows mean from 2 independent healthy human blood donors. Amplicon-Seq, RNA-Seq, and ATAC-seq data in panels b-d were generated 6 independent healthy human blood donors presented as mean +/− SD. Line-of-best-fit and R squared from a simple linear regression are shown for normally distributed data. RNA-seq data was log-transformed prior to linear regression. Spearman r is shown for non-linear correlations as determined by Shapiro-Wilk test (‘distance from cut site’ and ATAC-seq evaluations). Y axis for panels c-d is log 10. In c and d, separate analyses were performed for CD4 + (top) and CD8 + T cells (bottom) for RNA-Seq and ATAC-Seq comparisons. tNGFR = truncated nerve growth factor, MMEJ = microhomology mediated end joining, NHEJ = non-homologous end joining, ATAC = Assay for Transposase-Accessible Chromatin.
