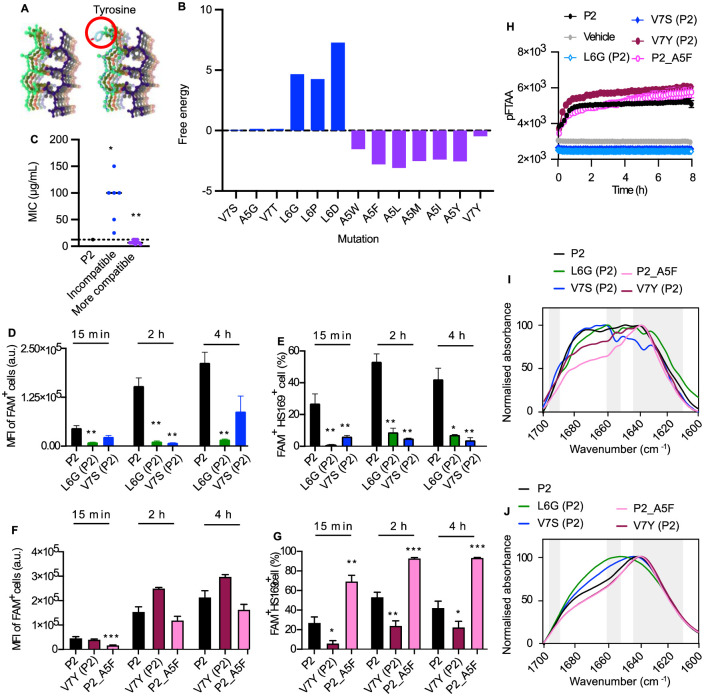
Fig 3. Optimizing the aggregate core structure enhances Pept-in antimicrobial potency.
A: The most likely structure predicted by Cordax for the amyloid core formed between P2 (left) and the APR of target proteins. The impact of introducing a mutant in the APR (e.g., V7Y) (right) can then be evaluated using the FoldX force field. B: Free energy of the APR structure calculated by FoldX after introducing a single mutation in the APR region. Blue bars represent mutations that are incompatible with the cross-beta core structure, while purple bars represent the ones that are more compatible with the cross-beta core structure. C: MIC of P2 variants generated by modifying the aggregate core structure against E. coli BL21. This figure is associated with data from S6 Table. Each dot represents the MIC of one Pept-in design. D-H: P2 variants which are incompatible with the cross-beta core structure: L6G (P2); V7S (P2); P2 variants which are more compatible with the cross-beta core structure more compatible: V7Y (P2), P2_A5F. D-G: Flow cytometry analysis of E. coli BL21 treated with FAM-labelled Pept-ins for different time points at FAM-P2-MIC from three independent experiments. Samples were acquired using Gallios Flow Cytometry. MFI of FAM+ cells (D), and the percentage+ of FAM and HS169+ cells (E) when treated with P2 and its derivatives with decreased antimicrobial potency. MFI of FAM+ cells (F), and the percentage+ of FAM and HS169+ cells (G) when treated with P2 and its derivatives with increased antimicrobial potency. Error bars represent SEM. H: Time dependence of pFTAA (0.5 μM) fluorescence intensity of P2 derivatives (50 μM) in the presence of PolyP (0.5 mM). (n = at least 6). I-J: FTIR spectrum of P2 variants with altered compatibility to the aggregate core structure in PBS (6% DMSO), without (I) or with (J) the presence of PolyP. The absorbance is normalised between all samples and the spectrum is scaled to the amide I region between 1600–1700 cm−1. Peaks within the left (1689–1696 cm−1) and right (1610–1642 cm−1) grey bar are assigned to β-sheet, while peaks within the grey bar in the middle (1651–1659 cm−1) is assigned to α-helix. The FTIR spectrums are representative of three independent experiments. For C, one-sample Wilcoxon signed-rank test was used to compare the MIC median of each Pept-in group to P2 MIC (12.5 μg/mL). For D-G, a two-tailed Student t-test was performed for calculating statistical significance between the mean of P2 variant and P2 (n = at least 6). Asterisks indicating the level of the p value centred over the error bar mean: *p < 0.05, **p < 0.01, ***p < 0.001, and ****p < 0.0001.

