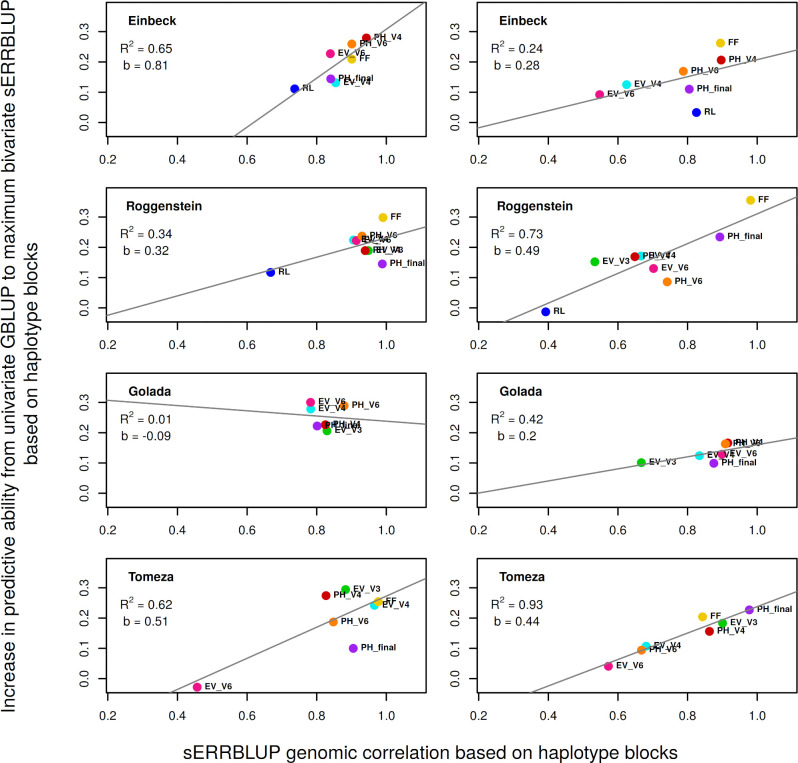
Fig 3.
Regression of the absolute increase in predictive ability from univariate GBLUP to maximum bivariate sERRBLUP on the respective sERRBLUP genomic correlation between 2017 and 2018 in Kemater (left) and in Petkuser (right) for all studied traits. In each panel, the overall linear regression line (gray solid line) with the regression coefficient (b) and R-squared (R2) are shown.

