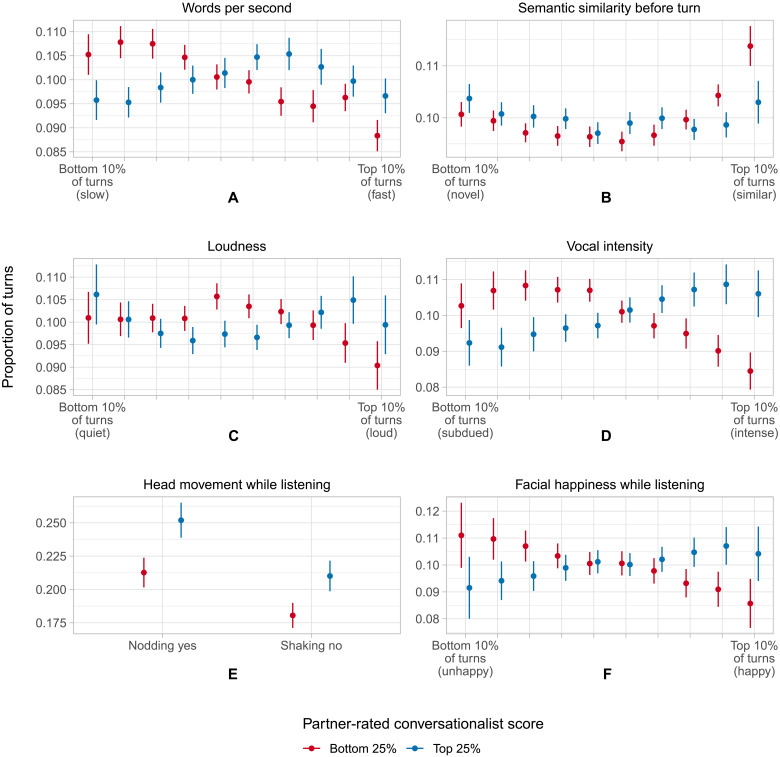
Fig. 8. Behavior patterns of good and bad conversationalists.
(A to F) The behavioral patterns of good conversationalists (top 25% of partner-rated conversationalist score; depicted in blue) and bad conversationalists (bottom 25%; depicted in red) are depicted. Horizontal axes denote turn-level feature deciles. The y axis indicates the mean proportion of turns in a category for a good or bad conversationalist. Error bars represent 95% confidence intervals. Top, middle, and bottom rows correspond to text, audio, and visual modalities, respectively; left and right columns include features that can be observed directly and those that require an additional layer of machine learning to estimate.

