. 2023 Mar 16;12:e82345. doi: 10.7554/eLife.82345

Figure 1. High-throughput profiling of tyrosine kinase substrate specificity using bacterial peptide display.

(A) Schematic representation of the workflow for kinase specificity profiling. (B) Heatmap depicting the specificity of the c-Src kinase domain, measured using the X5-Y-X5 library. Enrichment scores were log2-transformed and are displayed on a color scale from blue (disfavored sequence features, negative value), to white (neutral sequence features, near zero value), to red (favored sequence features, positive value). Values in the heatmap are the average of three replicates. (C) Correlation between position-specific amino acid enrichments from screens with the 4G10 Platinum and PY20 biotinylated pan-phosphotyrosine antibodies.

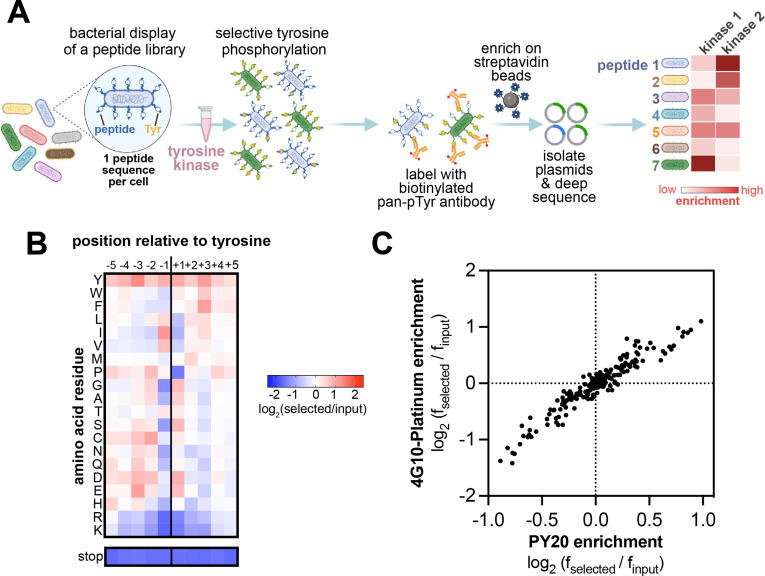
Figure 1.

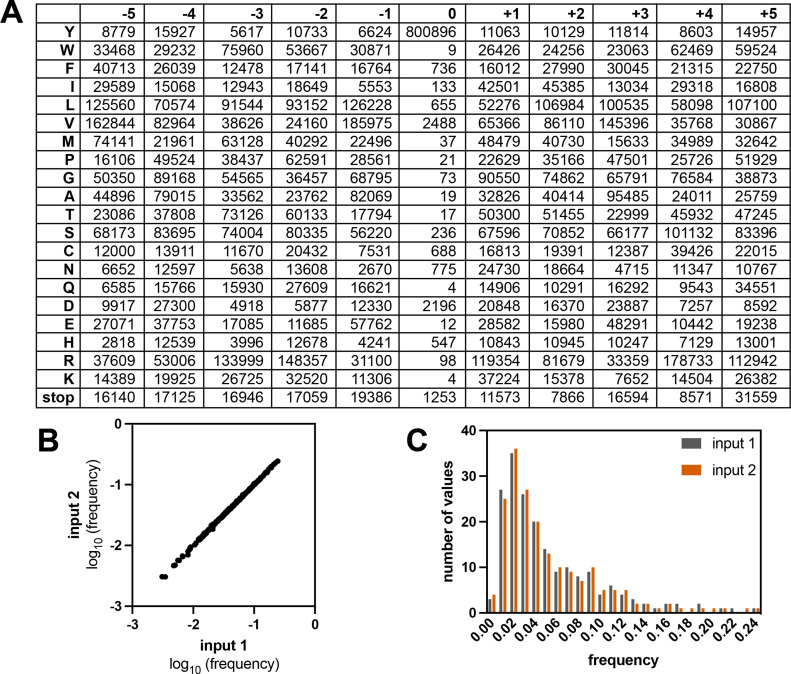
Figure 1—figure supplement 1. Composition of the X5-Y-X5 library.

Figure 1—figure supplement 1.

(A) Table showing the read counts for all amino acids and the stop codon across all positions in the strep-tagged X5-Y-X5 library, from one sequencing run with an unselected (input) library. (B) Correlation of amino acid frequencies at each position from two replicates of the input library. (C) Distribution of frequencies from two replicates of the input library.
Figure 1—figure supplement 1—source data 1. Counts table corresponding to one sequence run from an input X5-Y-X5 library.

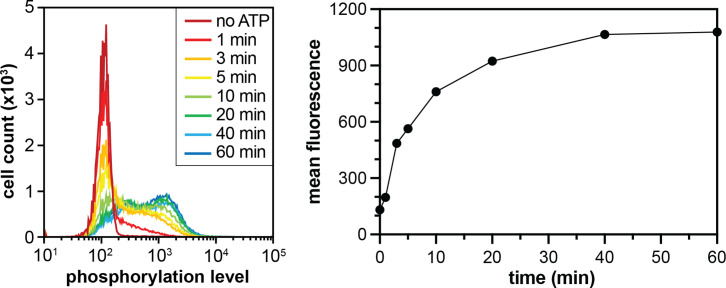
Figure 1—figure supplement 2. Phosphorylation of the X5-Y-X5 library by c-Src.

Figure 1—figure supplement 2.

Flow cytometry analysis monitoring the distribution of phosphotyrosine levels over time (left). The mean fluorescence intensities, which represent phosphorylation levels, plotted as a function of time (right).

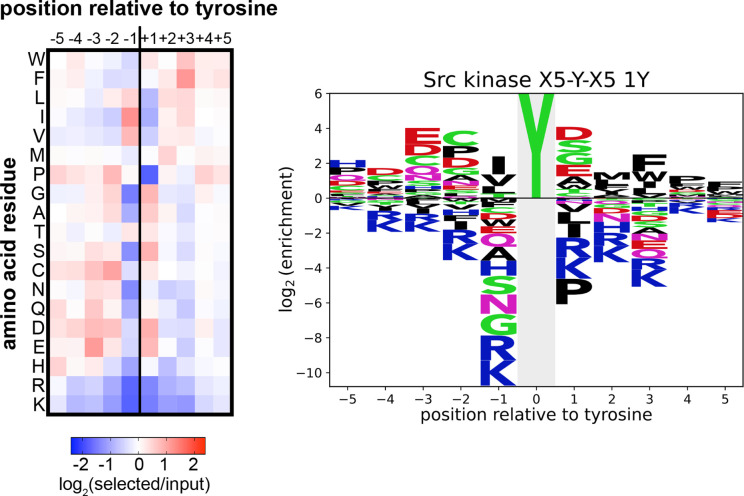
Figure 1—figure supplement 3. Heatmap and logo depicting the specificity of the c-Src kinase domain, measured using the X5-Y-X5 library.

Figure 1—figure supplement 3.

Only peptides with one central tyrosine were considered in this analysis. Enrichment scores were log2-transformed and are displayed on a color scale from blue (disfavored sequence features, negative value), to white (neutral sequence features, near zero value), to red (favored sequence features, positive value). The same values were used to plot the heatmap and the sequence logo. The height for the central ‘Y’ in the sequence logo is an arbitrary value, chosen for optimal visualization of other features. Values are the average of three replicates.