. 2023 Mar 16;12:e82345. doi: 10.7554/eLife.82345

Figure 2. Specificity profiling of tyrosine kinases using the X5-Y-X5 library.

(A) Heatmaps depicting the specificities of c-Abl, Fer, EPHB1, and EPHB2. Enrichment scores were log2-transformed and are displayed on a color scale from blue (disfavored sequence features, negative value), to white (neutral sequence features, near zero value), to red (favored sequence features, positive value). Values in the heatmaps are the average of three replicates. (B) Sequences of consensus peptides identified through X5-Y-X5 screens, compared with previously reported SrcTide and AblTide sequences. (C) Phosphorylation kinetics of five consensus peptides against five kinases. Initial rates were normalized to the rate of the cognate consensus peptide. All peptides were used at a concentration of 100 μM, and the kinases were used at a concentration of 10–50 nM. Error bars represent the standard deviation from at least three measurements.

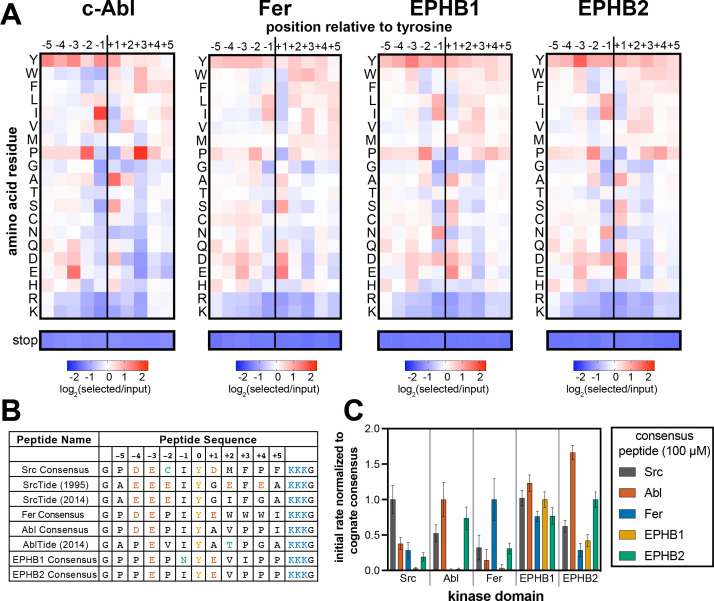
Figure 2—source data 1. Position-specific amino acid enrichment matrices from the tyrosine kinase X5-Y-X5 library screens.
Matrices calculated with and without inclusion of multi-tyrosine sequences are provided.

Figure 2.

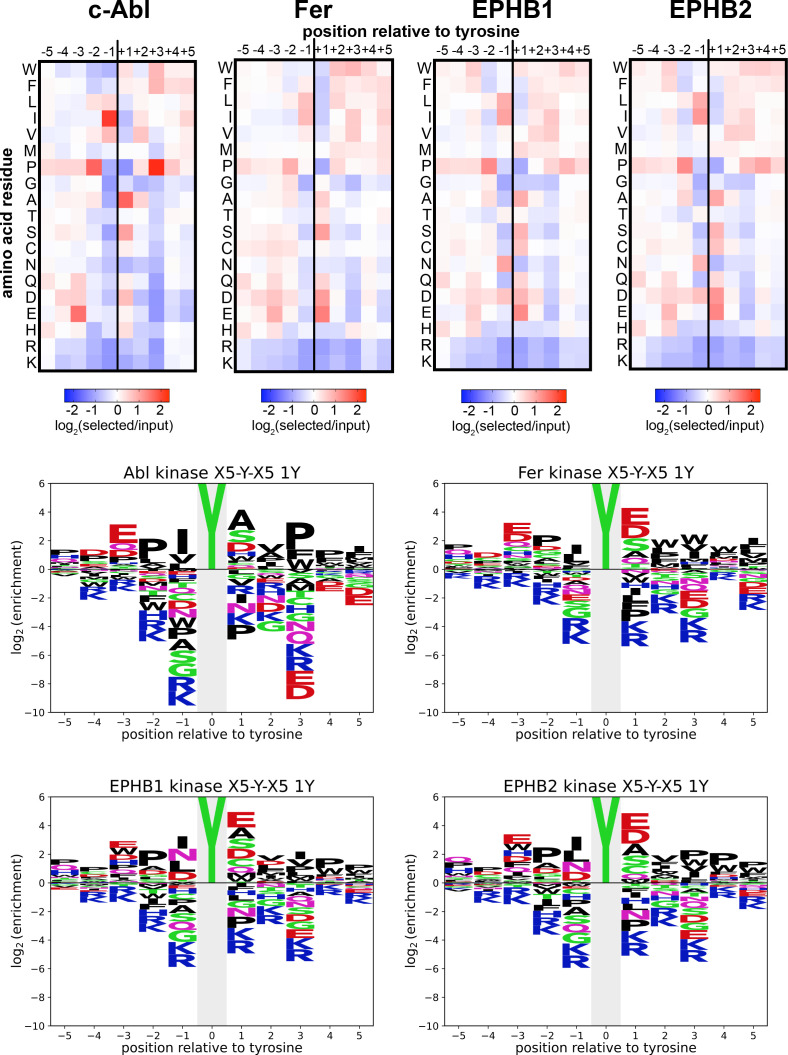
Figure 2—figure supplement 1. Heatmaps and logos depicting the specificities of c-Abl, Fer, EPHB1, and EPHB2.

Figure 2—figure supplement 1.

Only peptides with one central tyrosine were considered in this analysis. Enrichment scores were log2-transformed and are displayed on a color scale from blue (disfavored sequence features, negative value), to white (neutral sequence features, near zero value), to red (favored sequence features, positive value). The same values were used to plot the heatmaps and the sequence logos. The height for the central ‘Y’ in the sequence logos is an arbitrary value, chosen for optimal visualization of other features. Values are the average of three replicates.
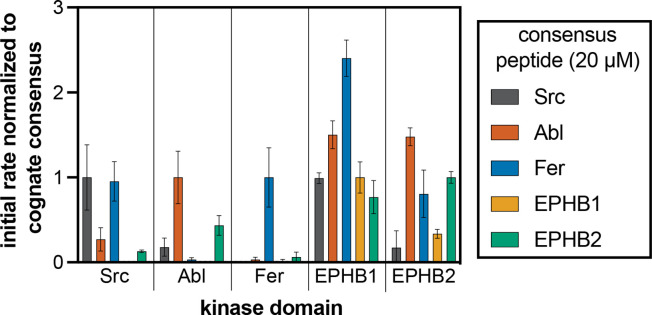
Figure 2—figure supplement 2. Phosphorylation kinetics of five consensus peptides against five kinases.

Figure 2—figure supplement 2.

Initial rates measured for each kinase were normalized to the rate of the corresponding consensus peptide. All peptides were used at a concentration of 20 μM, and the kinases were used at a concentration of 10–50 nM. Error bars represent the standard deviation from at least three measurements.