. 2023 Mar 16;12:e82345. doi: 10.7554/eLife.82345

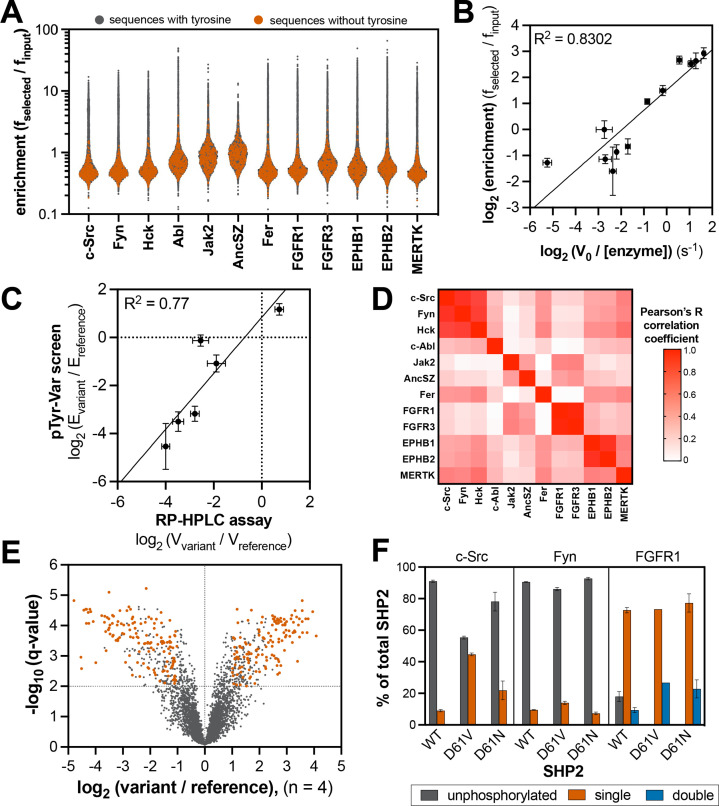
Figure 4. Specificity profiling of tyrosine kinases using the pTyr-Var library.

(A) Distribution of enrichment scores from pTyr-Var screens with 13 tyrosine kinases. Each point represents a peptide sequence in the pTyr-Var library. Data points in orange-red represent sequences without a Tyr residue and data points in dark gray represent sequences with a Tyr residue. Each dataset represents the average of three to five replicates. (B) Correlation between enrichment scores and measured phosphorylation rates for 12 peptides (100 μM) with c-Src (500 nM). (C) Correlation between the magnitude of mutational effects for 6 peptide pairs in the pTyr-Var library with mutational effects measured using an in vitro kinetic assay. Error bars in panels B and C represent the standard deviation from 3 to 4 rate measurements and four pTyr-Var screens. (D) Matrix of Pearson’s correlation coefficients for all pairwise comparisons between replicate-averaged pTyr-Var datasets for 13 kinases. (E) Volcano plot depicting mutational effects in the pTyr-Var screen with c-Src kinase domain. Data points represent the average of four replicates. Hits are colored orange-red. (F) Percent phosphorylation of SHP2 wild-type, D61V, and D61N (10 μM) after an hour incubation with c-Src, Fyn, and FGFR1 (1 μM). Error bars represent the standard deviation from 2 to 3 measurements.

Figure 4—source data 1. Enrichment scores from tyrosine kinase pTyr-Var screens.
Data are provided in a flat sheet with average and standard deviation values for all kinase-substrate pairs. Data are also provided for each kinase as a side-by-side comparison of enrichment scores reference and variant sequences and whether the mutation was considered a significant in our analysis. Three sheets are provided listing substrates for c-Src, Fyn, and c-Abl that are also found in a curated list of kinase-substrate pairs in the PhosphositePlus database.
Figure 4—source data 2. Position-specific amino acid enrichment matrices from the tyrosine kinase pTyr-Var library screens for sequences containing a single central tyrosine residue.

Figure 4.

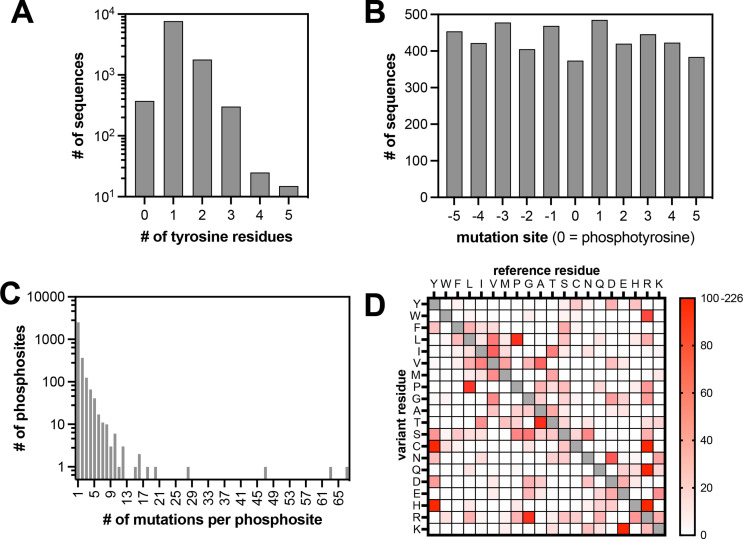
Figure 4—figure supplement 1. Properties of the pTyr-Var library.

Figure 4—figure supplement 1.

(A) Frequency of sequences in the library with different numbers of tyrosine residues. (B) Positions of mutations across the library relative to the central tyrosine (zero-position). (C) Frequency of substitutions associated with each phosphosite. (D) Abundance of each possible amino acid substitution across the library.
Figure 4—figure supplement 2. Pre-activation of FGFR1, FGFR3, and MERTK by auto-phosphorylation.

Figure 4—figure supplement 2.

Kinases (25 μM) were incubated with ATP (5 mM) in a magnesium-containing neutral pH buffer for 0.5–2 hr, then desalted and concentrated to remove excess ATP. Proteins were analyzed by electrospray-ionization mass spectrometry. The envelope of multiply-charged states was deconvoluted using the instrument software, and the deconvoluted spectra are shown. The number of phosphorylation events on each kinase is labeled.
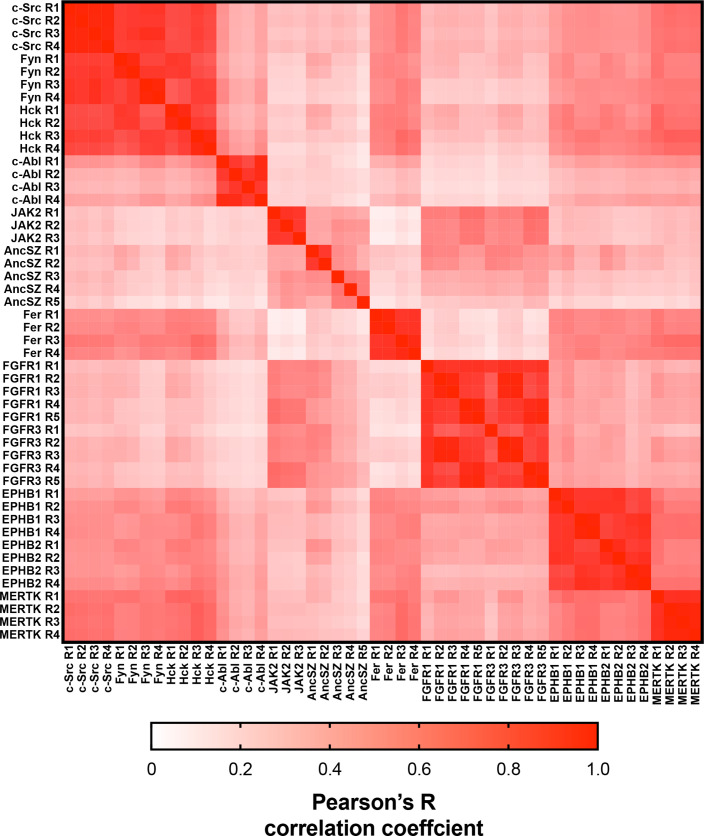
Figure 4—figure supplement 3. Matrix of Pearson’s correlation coefficients for all replicates of pTyr-Var screens across all 12 kinases.

Figure 4—figure supplement 3.

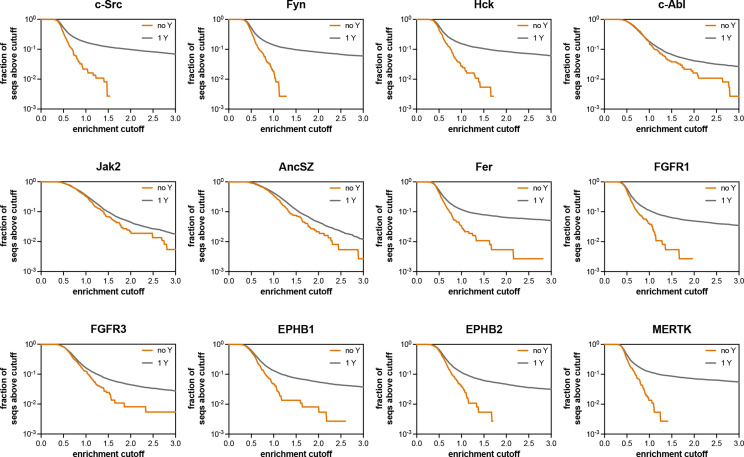
Figure 4—figure supplement 4. Assessment of the extent of enrichment in pTyr-Var screens with 12 kinases.

Figure 4—figure supplement 4.

These graphs assess what fraction of the sequences containing no Tyr residue (out of 370 sequences) and what fraction of the sequences containing 1 Tyr residue (out of 7468 sequences) have an enrichment score above the cutoff value indicated on the x-axis.
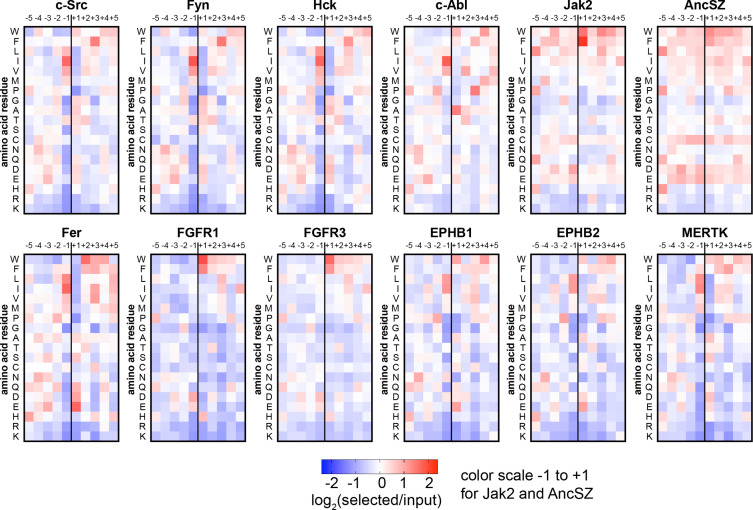
Figure 4—figure supplement 5. Heatmaps depicting the position-specific amino acid preferences for 12 tyrosine kinase domains, extracted from screens with the pTyr-Var library.

Figure 4—figure supplement 5.

Only sequences with a single central tyrosine were considered in this analysis. Position-specific amino acid enrichment scores were calculated by taking the average log2-transformed enrichment of every sequence with that particular feature. Values are displayed on a color scale from blue (disfavored sequence features, negative value), to white (neutral sequence features, near zero value), to red (favored sequence features, positive value). Values in the heatmaps are the average of three to five replicates.
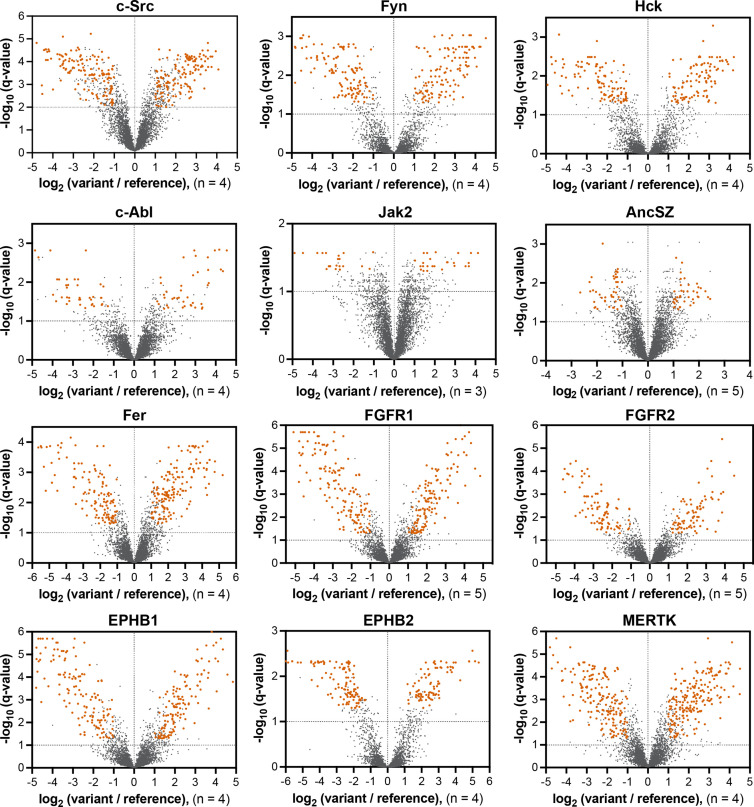
Figure 4—figure supplement 6. Volcano plots depicting mutational effects in the pTyr-Var screen for 12 kinase domains.

Figure 4—figure supplement 6.

Datasets are the average of three to five replicates. Significant hits are colored in orange-red.
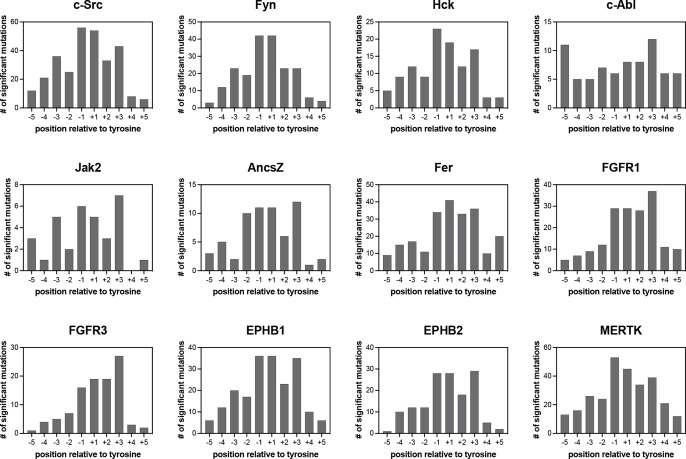
Figure 4—figure supplement 7. Number of significant mutations for each kinase at each position surrounding the central tyrosine residue.

Figure 4—figure supplement 7.

Mutations that added or removed a tyrosine residue were excluded from these counts.
Figure 4—figure supplement 8. Enrichment scores from pTyr-Var screens for phosphorylation of the RET Tyr 981 reference and variant (R982C) peptides by 12 tyrosine kinases.
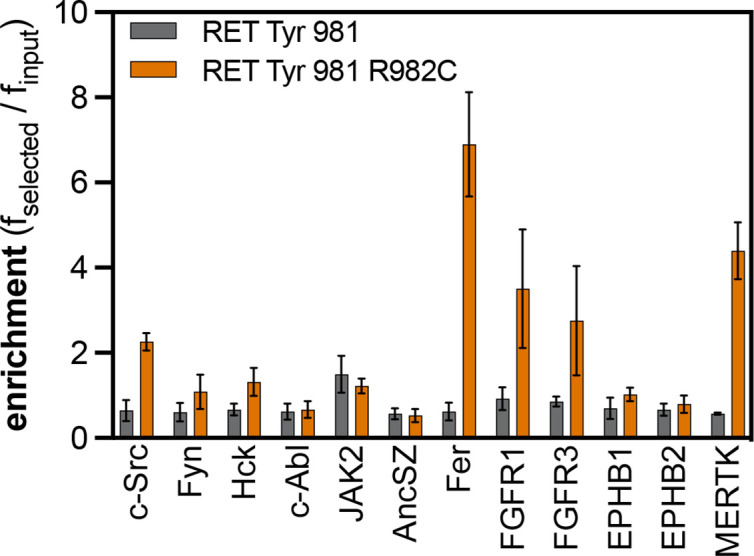
Figure 4—figure supplement 8.

Error bars represent the standard deviations from three to five replicates.
Figure 4—figure supplement 9. Enrichment scores from pTyr-Var screens for phosphorylation of SHP2 Y62 reference and variant (D61N and D61V) peptides by c-Src, Fyn, and FGFR1.
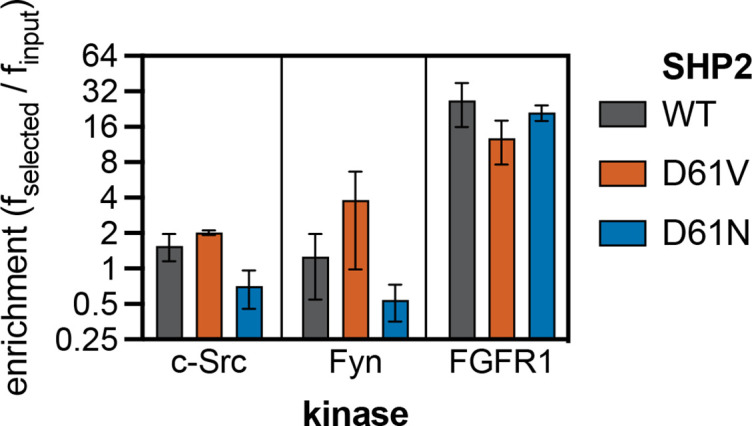
Figure 4—figure supplement 9.

Error bars represent the standard deviations from three to five replicates.