. 2023 Mar 16;12:e82345. doi: 10.7554/eLife.82345

Figure 7. Expansion of peptide display libraries using Amber suppression.

(A) Non-canonical amino acids used in this study. CMF = 4-carboxymethyl phenylalanine, AzF = 4-azido phenylalanine, and AcK = N-ε-acetyl-L-lysine. (B) Amber suppression in the strep-tagged X5-Y-X5 library using CMF. Library surface-display level was monitored by flow cytometry using a fluorophore-labeled StrepMAB antibody for samples with or without Amber suppression components. (C) AzF labeling on bacterial cells using a DIBO-conjugated fluorophore. Cells expressing the X5-Y-X5 library, with and without various Amber suppression components, were treated with DIBO-conjugated Alexa Fluor 555 then analyzed by flow cytometry. (D) Heatmaps depicting the specificities of c-Src, Hck, and c-Abl after CMF or acetyl lysine incorporation. Only sequences with one stop codon were used in this analysis. Enrichment scores were log2-transformed and are displayed on a color scale from blue (disfavored), to white (neutral), to red (favored). Values in heatmaps are the average of three replicates.

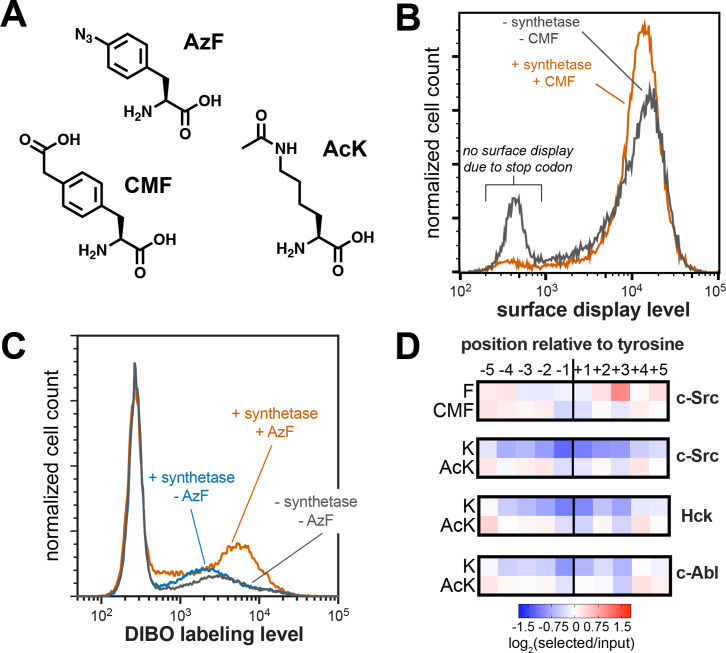
Figure 7.

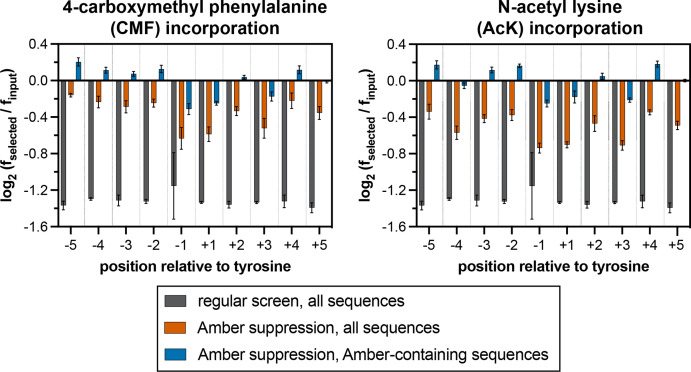
Figure 7—figure supplement 1. Stop codon enrichment levels in c-Src X5-Y-X5 screens using different analysis methods.

Figure 7—figure supplement 1.

Error bars represent the standard deviations from three screens.
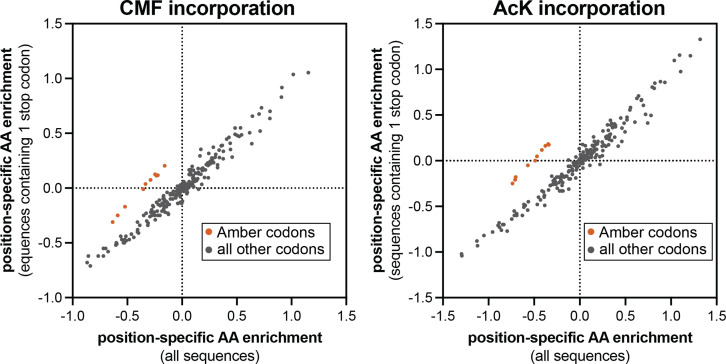
Figure 7—figure supplement 2. Comparison of position-specific enrichments in screens with Amber suppression analyzed in two different ways.

Figure 7—figure supplement 2.

In each plot, the enrichment of specific amino acids or a stop codon, after phosphorylation by c-Src and bead-based selection, were calculated using two different methods. X-values indicate log-transformed enrichment values calculated across all sequences in the library. Y-values indicate log-transformed enrichment values only for sequences that contain exactly one Amber stop codon. The orange-red points correspond to the Amber codon enrichments at all 10 positions, which selectively fall off of the x=y diagonal line.
Figure 7—figure supplement 3. Phosphorylation kinetics of Lys- and AcK-containing consensus peptides against c-Src and c-Abl.

Figure 7—figure supplement 3.

Initial rates measured for each kinase were normalized to the rate of the corresponding cognate consensus peptide. Peptides were used at a concentration of 100 or 20 μM, and the kinases were used at a concentration of 10–50 nM. Error bars represent the standard deviation from three measurements.