
Figure 5.
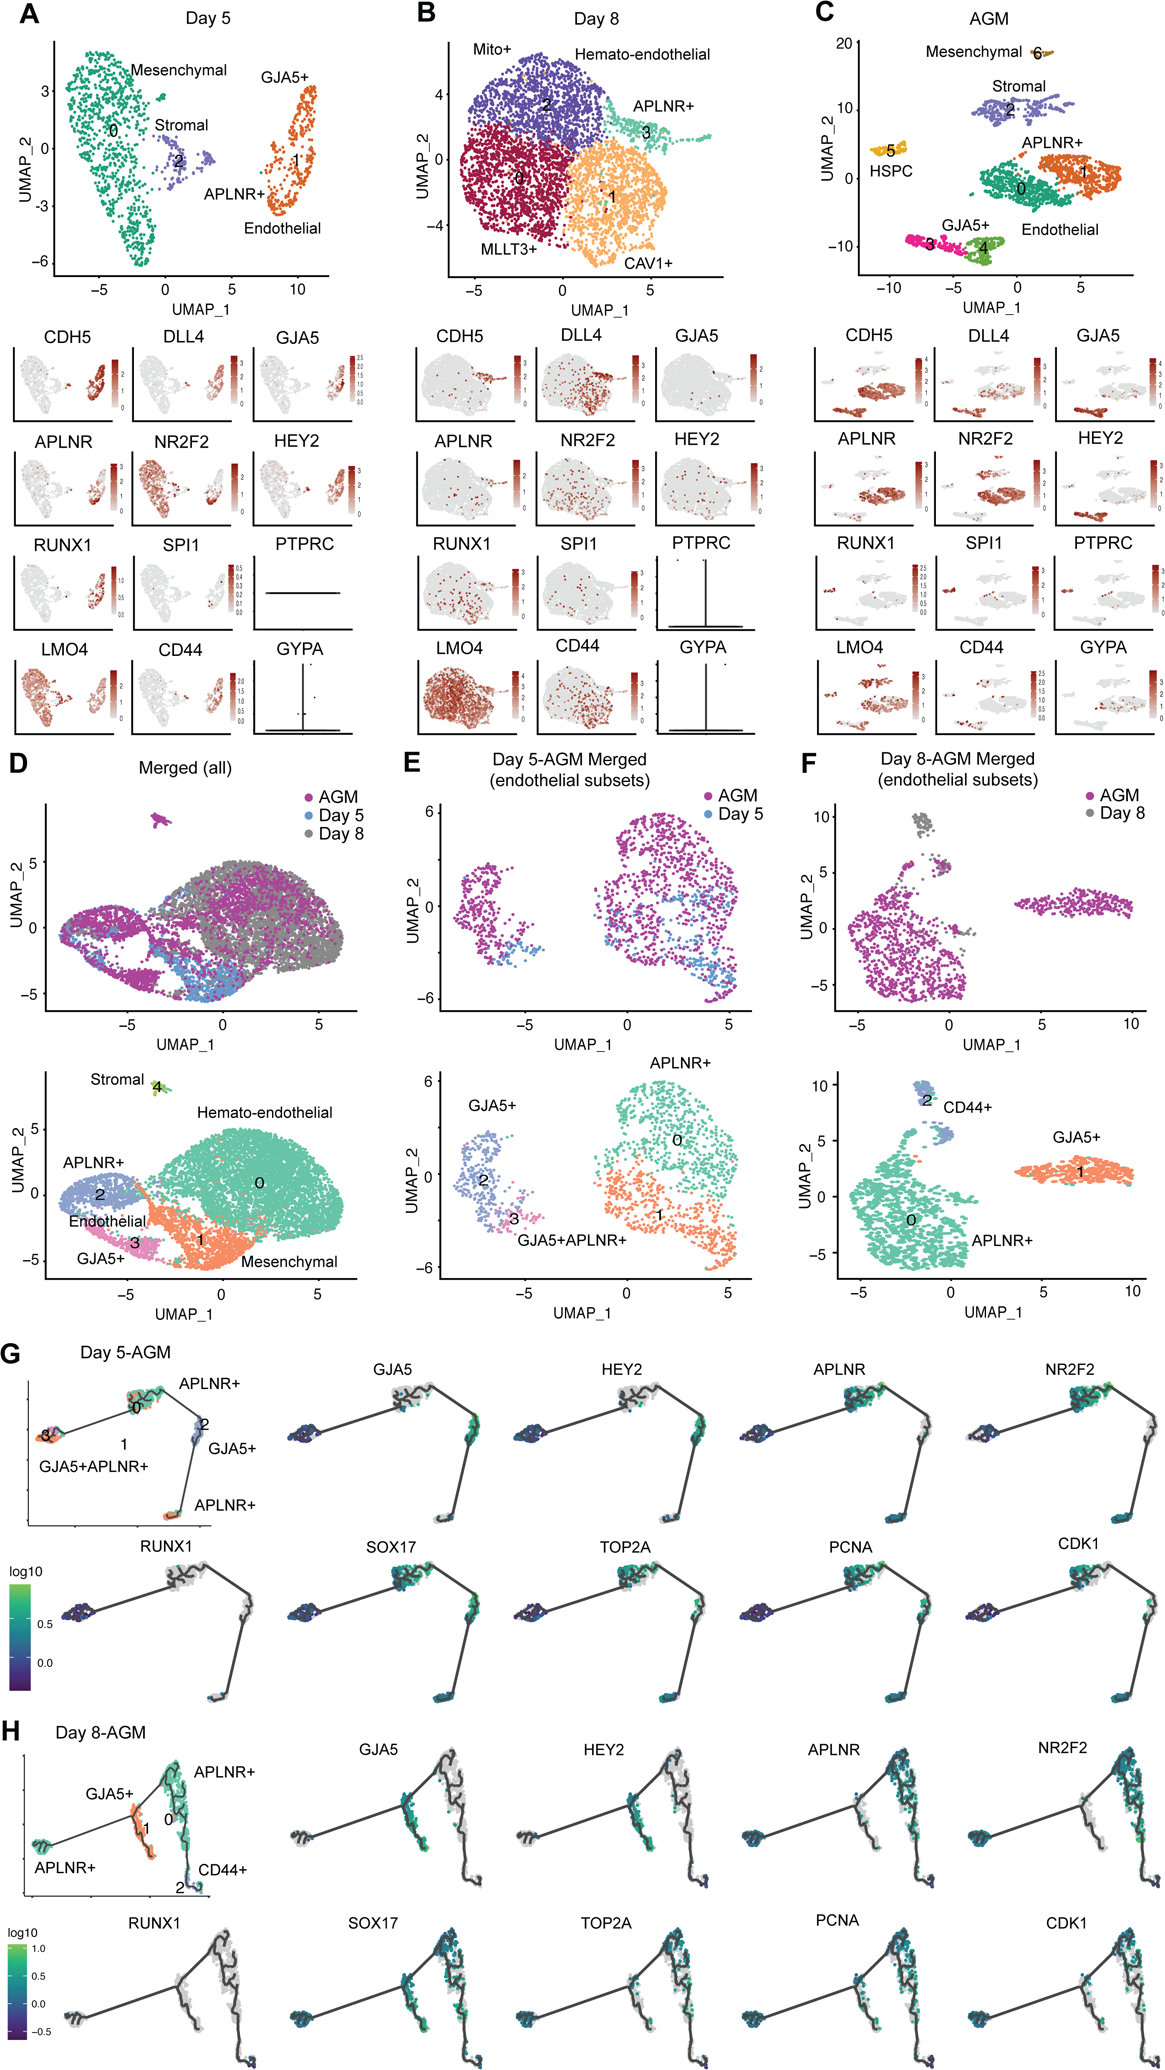
Comparative transcriptome analysis of hPSC-derived and primary aorta-gonad-mesonephros (AGM) hemato-endothelial cells. (A–C) Clustering and UMAP embedding of scRNA-seq data of day 5 (A), day 8 (B) and AGM [34] (C) samples were colored by meta-clusters to simplify visualization. Cell identities were assigned to the clusters based on their expression of key marker genes. Gene expression plots of endothelial and hematopoietic cell markers are also shown. Violin plots for PTPRC and GYPA at day 5 (A) and day 8 (B) were used due to their low expression. (D–F) Clustering and UMAP embedding of scRNA-seq data of merged day 5, day 8 and AGM samples (D), endothelial subsets of merged day 5/AGM (E) and day 8/AGM (F) were colored by meta-clusters to simplify visualization. The lower panels in (D) are cell clusters of merged scRNA-seq samples, in which cell identities were assigned based on their expression of key marker genes. (G–H) Pseudotime trajectory analysis using Monocle 3 of the merged day 5/AGM (G) and day 8/AGM (H) identifies the potential developmental trajectory within the heterogenous endothelial cells. Gene expression plots of hemato-endothelial and cell cycle markers for merged day 5/AGM and day 8/AGM samples were also shown.