Figure 6.

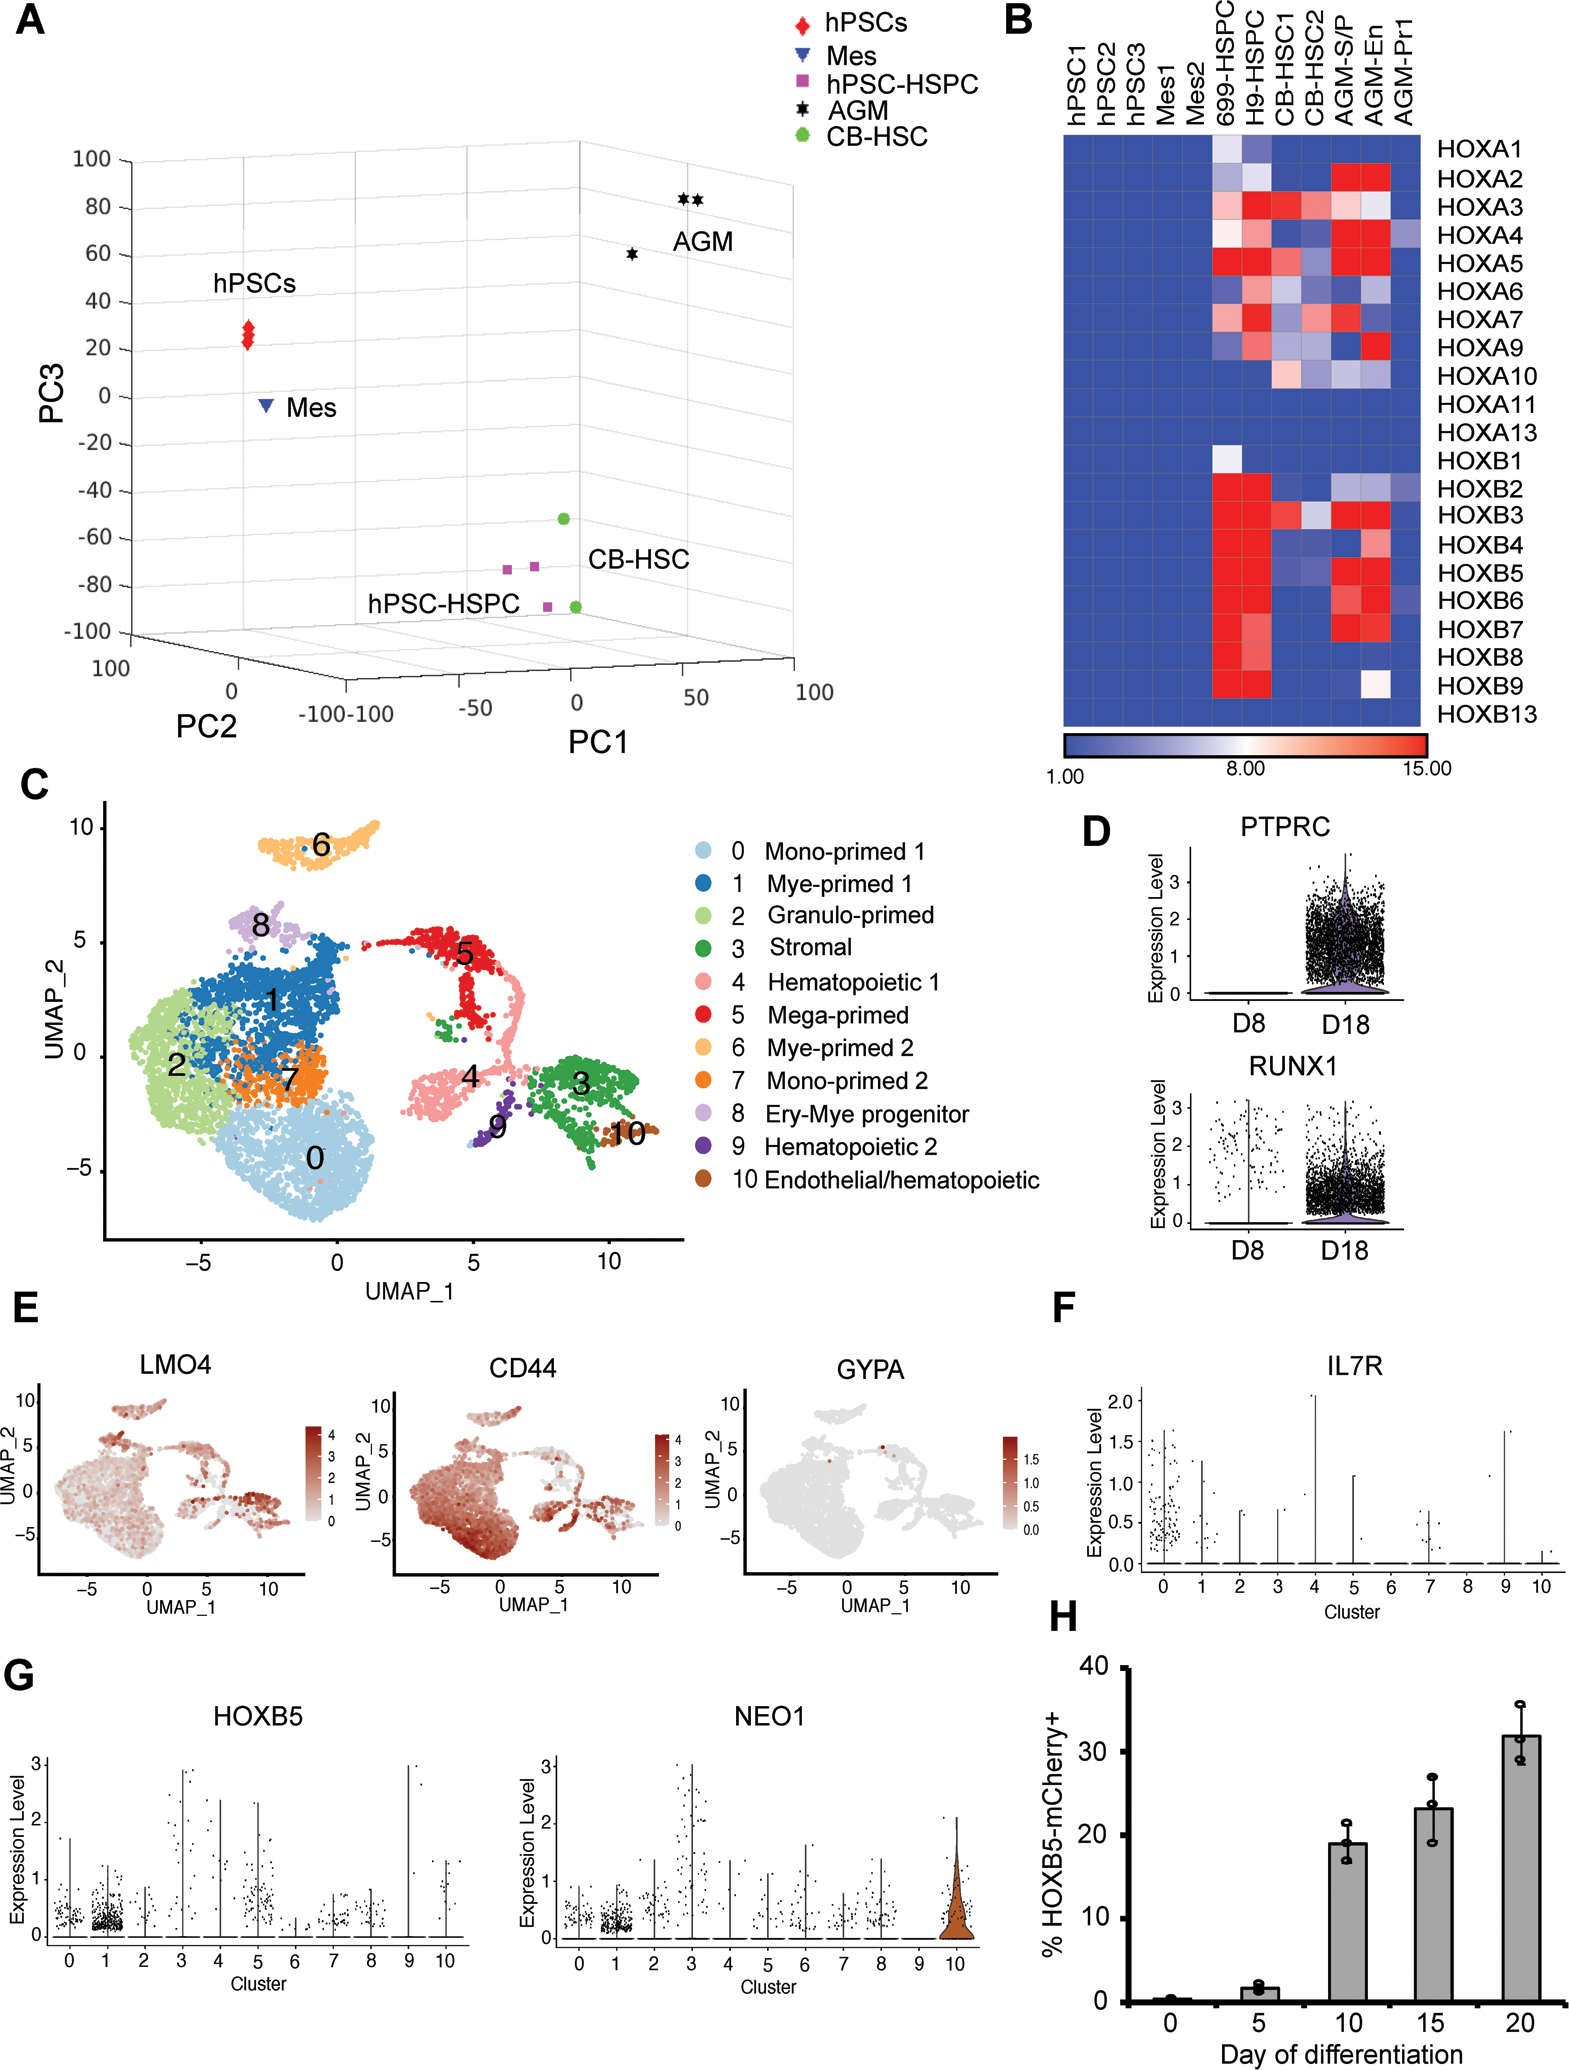
Transcriptome analysis of hPSC-derived definitive hematopoietic cells. (A) 3D scores plot of the first three principal components (PCs) from the principal component analysis on the RNA-sequencing data of hPSCs, hPSC-derived mesoderm (Mes), day 18 hematopoietic stem-like cells (hPSC-HSC), primary neonatal cord-blood HSCs (CB-HSC), 5-week aorta-gonad-mesonephros (AGM) endothelial, stem/progenitor and progenitor cells. Each data point corresponds to different biological samples. RNA-seq data of primary CB-HSC [37] and AGM cells [10] were obtained from previous publications. (B) Heatmap showing similar expression patterns of HOXA and HOXB gene clusters among hPSC-derived, CB and AGM hematopoietic cells. (C) UMAP embedding of day 18 scRNA-seq data colored by meta-clusters to simplify visualization. Mono: monocytes; Mye: myeloid cells; Granulo: granulocytes; Ery: erythroid cells; Mega: megakaryocytes. Violin plots of RNA counts of two hematopoietic progenitor markers PTPRC and RUNX1, and UMAP plots of two definitive and one primitive hematopoietic cell markers are shown in (D) and (E). (F–G) Violin plots of T-cell progenitor marker IL7R, and hematopoietic cell marker HOXB5 and NEO1 along different clusters are shown in (F) and (G). (H) VEcad-eGFP HOXB5-mCherry dual reporter H9 hPSCs were differentiated as illustrated in Fig. 4A. At different time points, HOXB5-mCherry expression was assessed by flow cytometry. Data are represented as mean ± s. e.m of three independent replicates.
