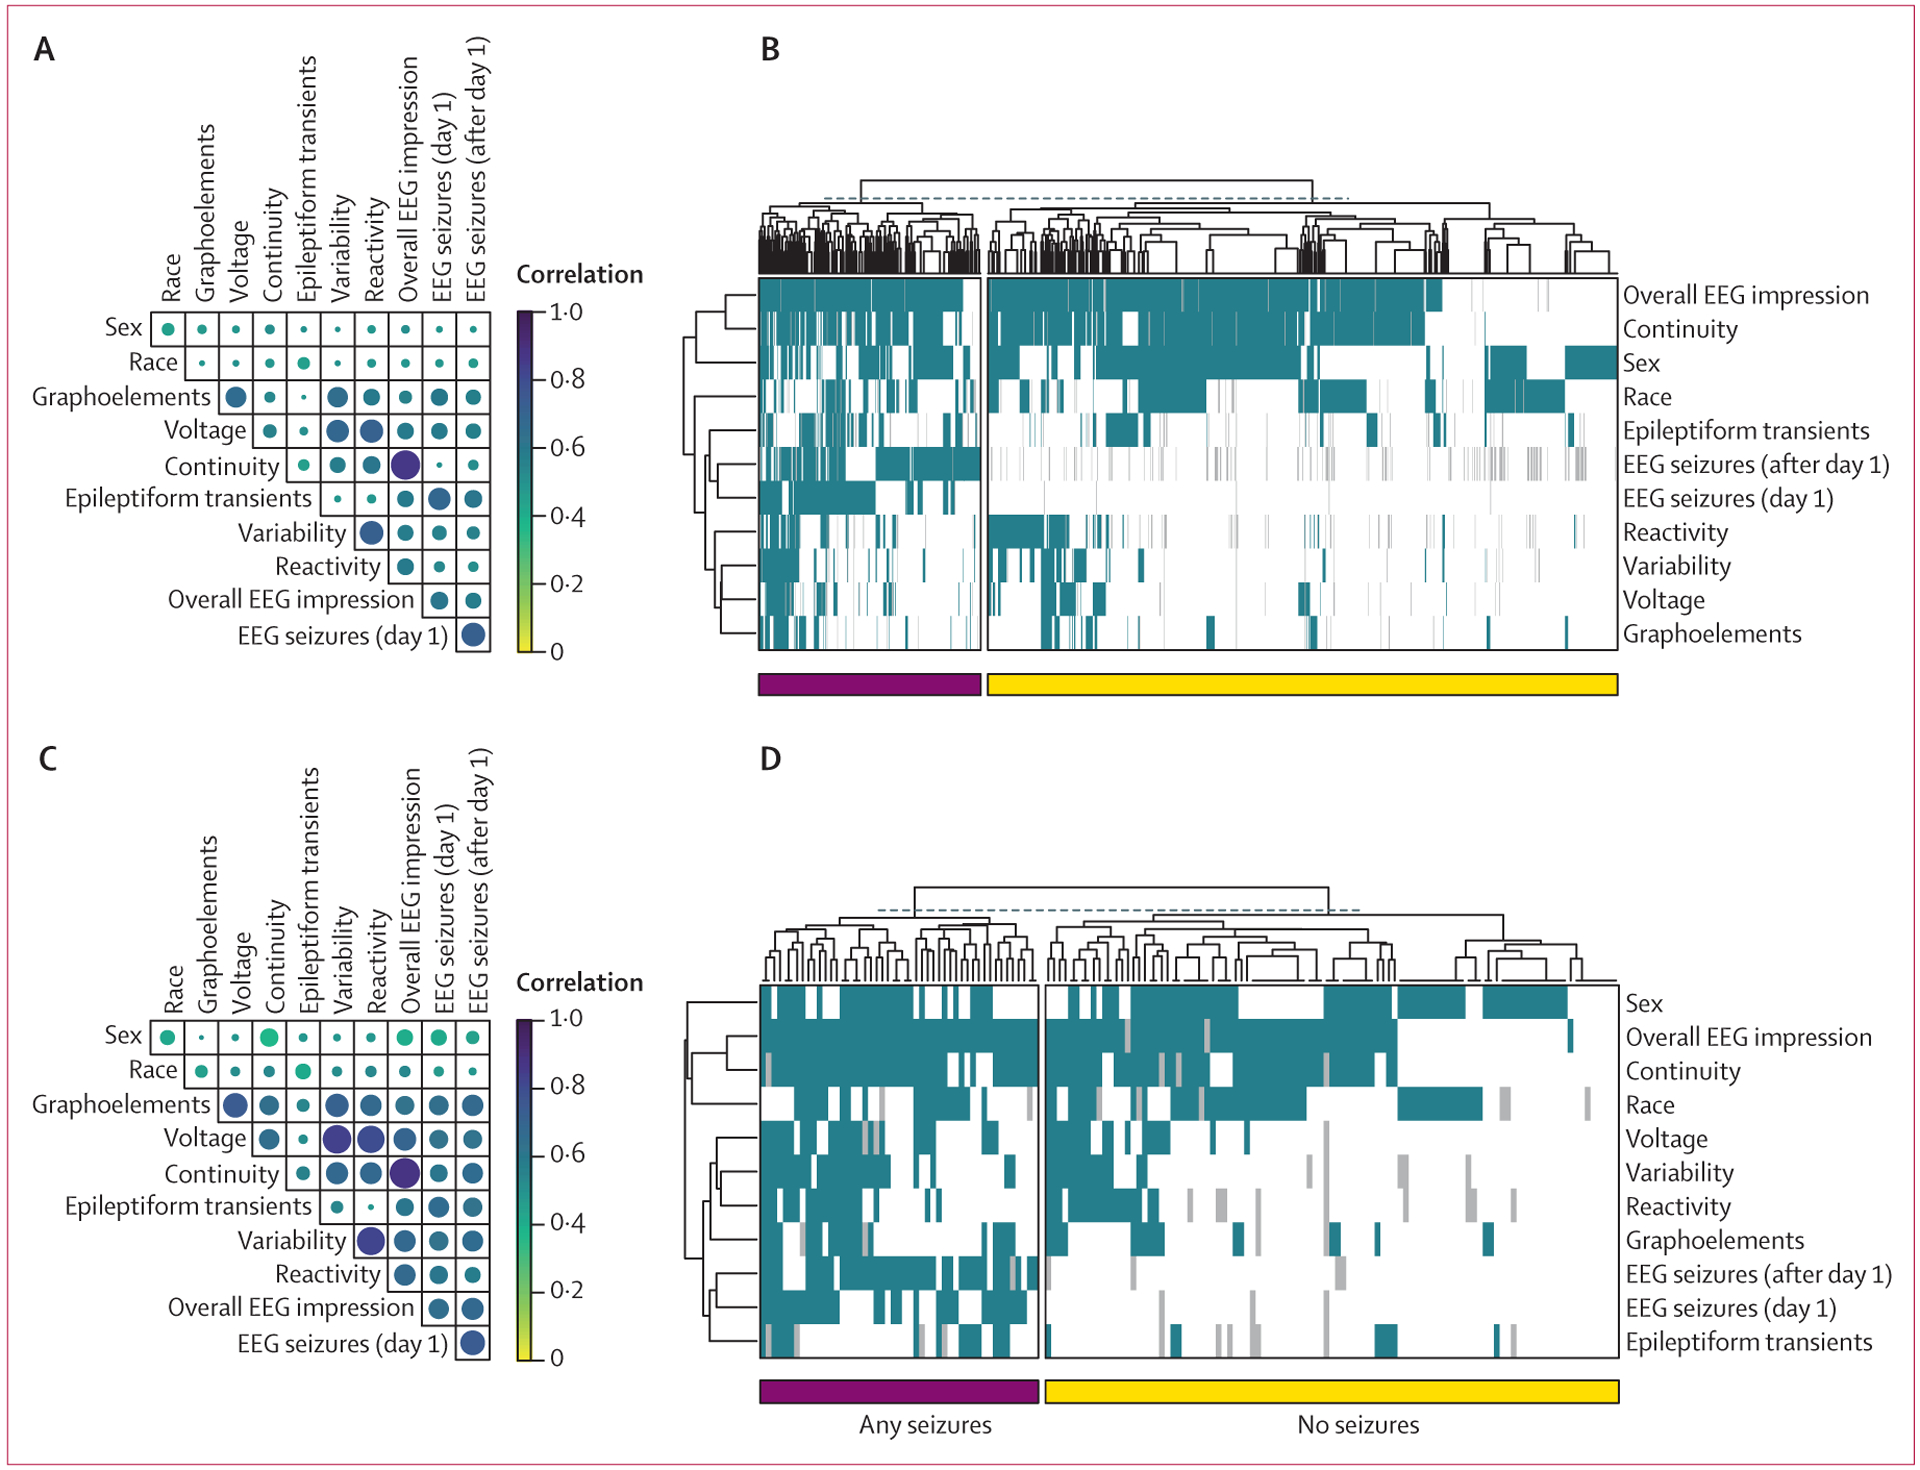
Figure 2: Feature correlation and clustering.

Cross-correlation coefficients for all EEG features are shown for the entire neonatal cohort (A) and the subgroup of neonates with hypoxic ischaemic encephalopathy (C). Features with the strongest correlations include impression and continuity. Clustering of individuals on the basis of EEG feature representation did not clearly segment patients based on the presence or absence of seizures for the overall cohort (B) or the subgroup of neonates with hypoxic ischaemic encephalopathy (D). Seizures (day 1) are those occurring on the first day of EEG recording, whereas seizures (after day 1) represent all subsequent seizures. EEG=electroencephalogram.
