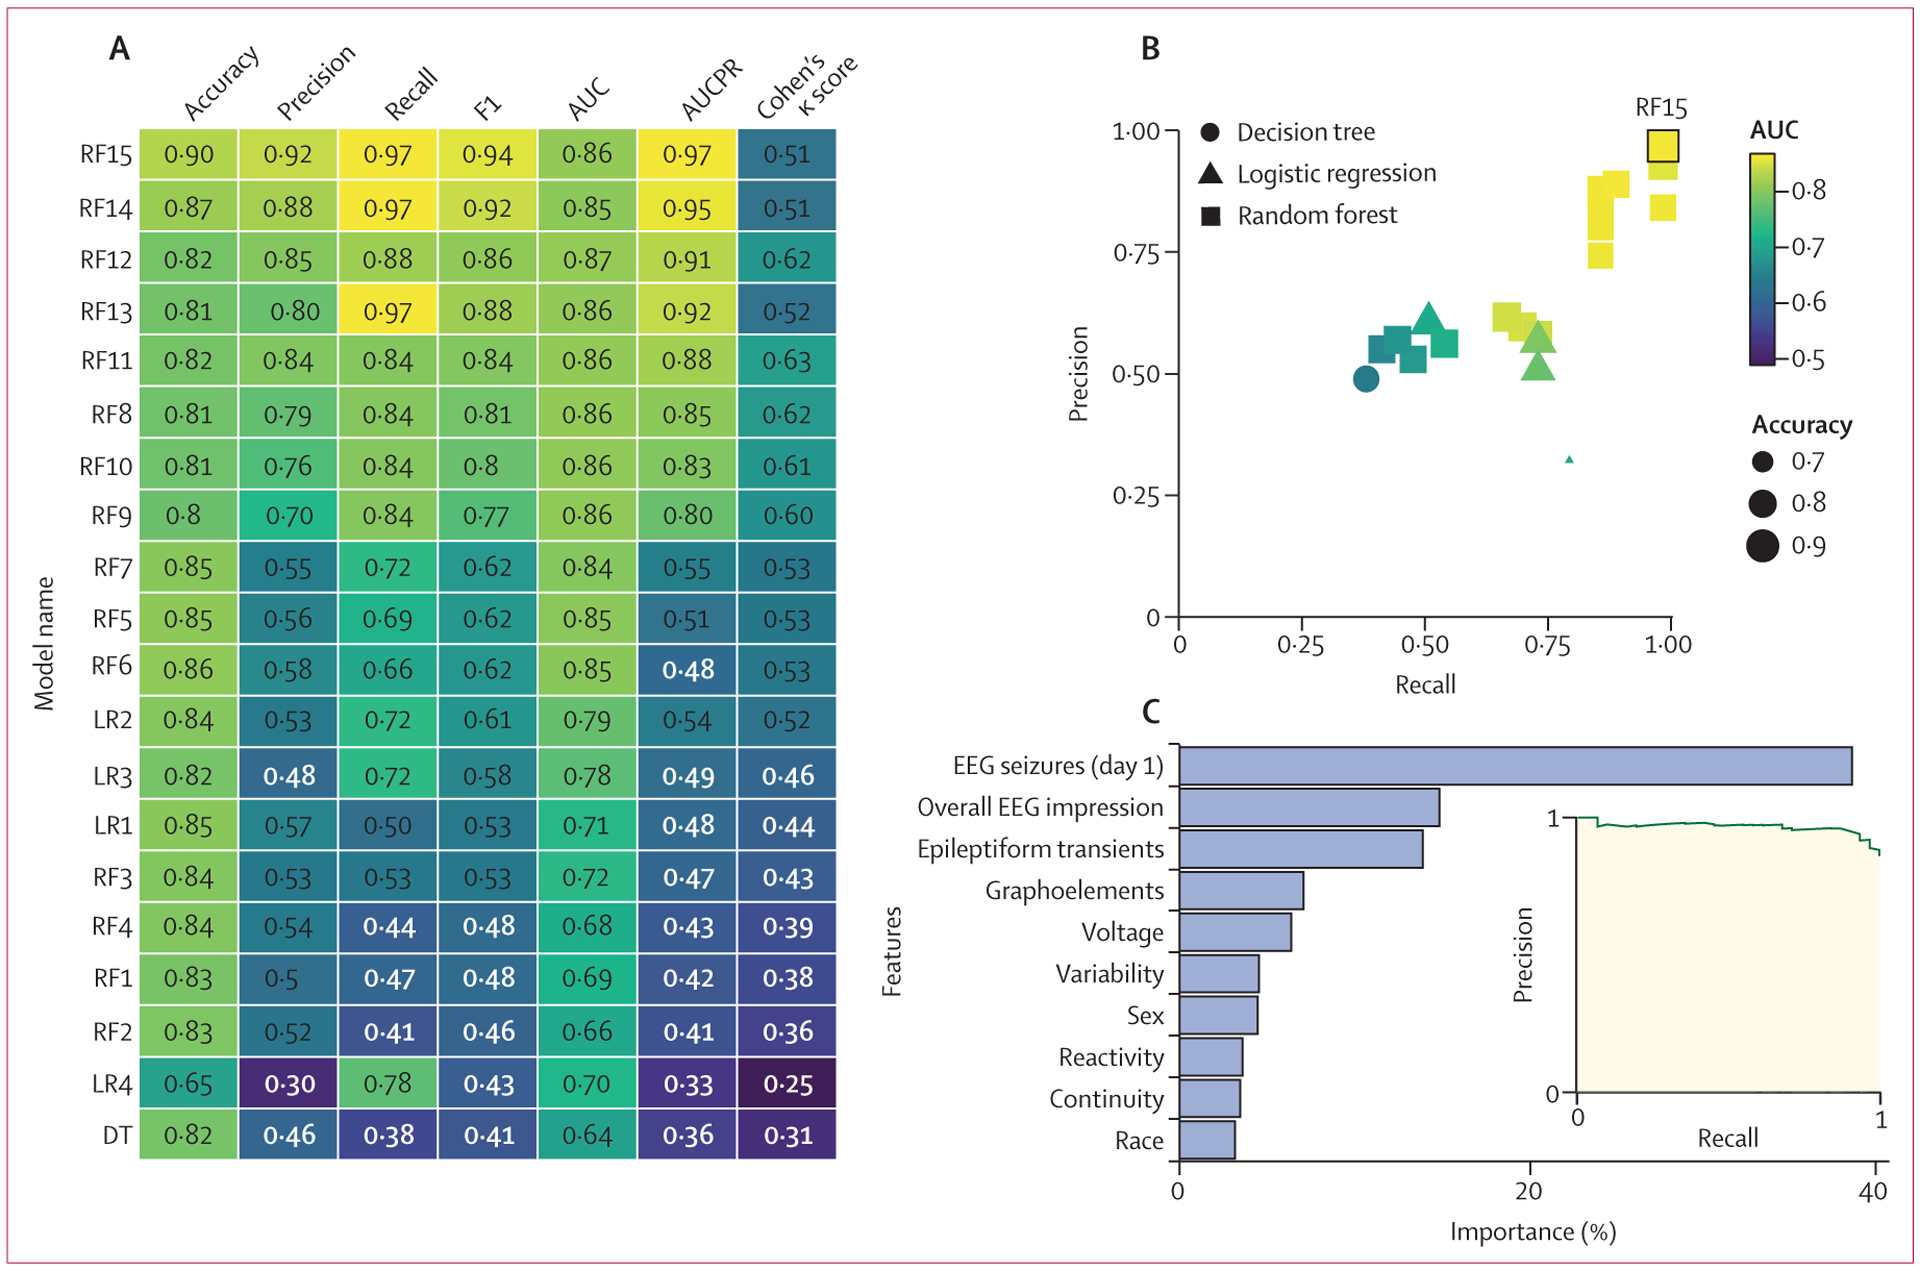
Figure 3: Model performance for all neonates.

(A) Performance values are displayed for the logistic regression (LR1–LR4), decision tree (DT), and random forest (RF1–RF15) models tested on the entire neonatal cohort. Accuracy, precision, recall, F1, AUC, AUCPR, and Cohen’s κ scores are provided for each model. Lighter colours represent better performance. (B) The precision of each model plotted over recall for all 20 models, coded by type, AUC, and accuracy. (C) The relative importance of each feature in the model and the AUCPR are shown for model RF15. AUC=area under the curve. AUCPR=area under the precision–recall curve.
