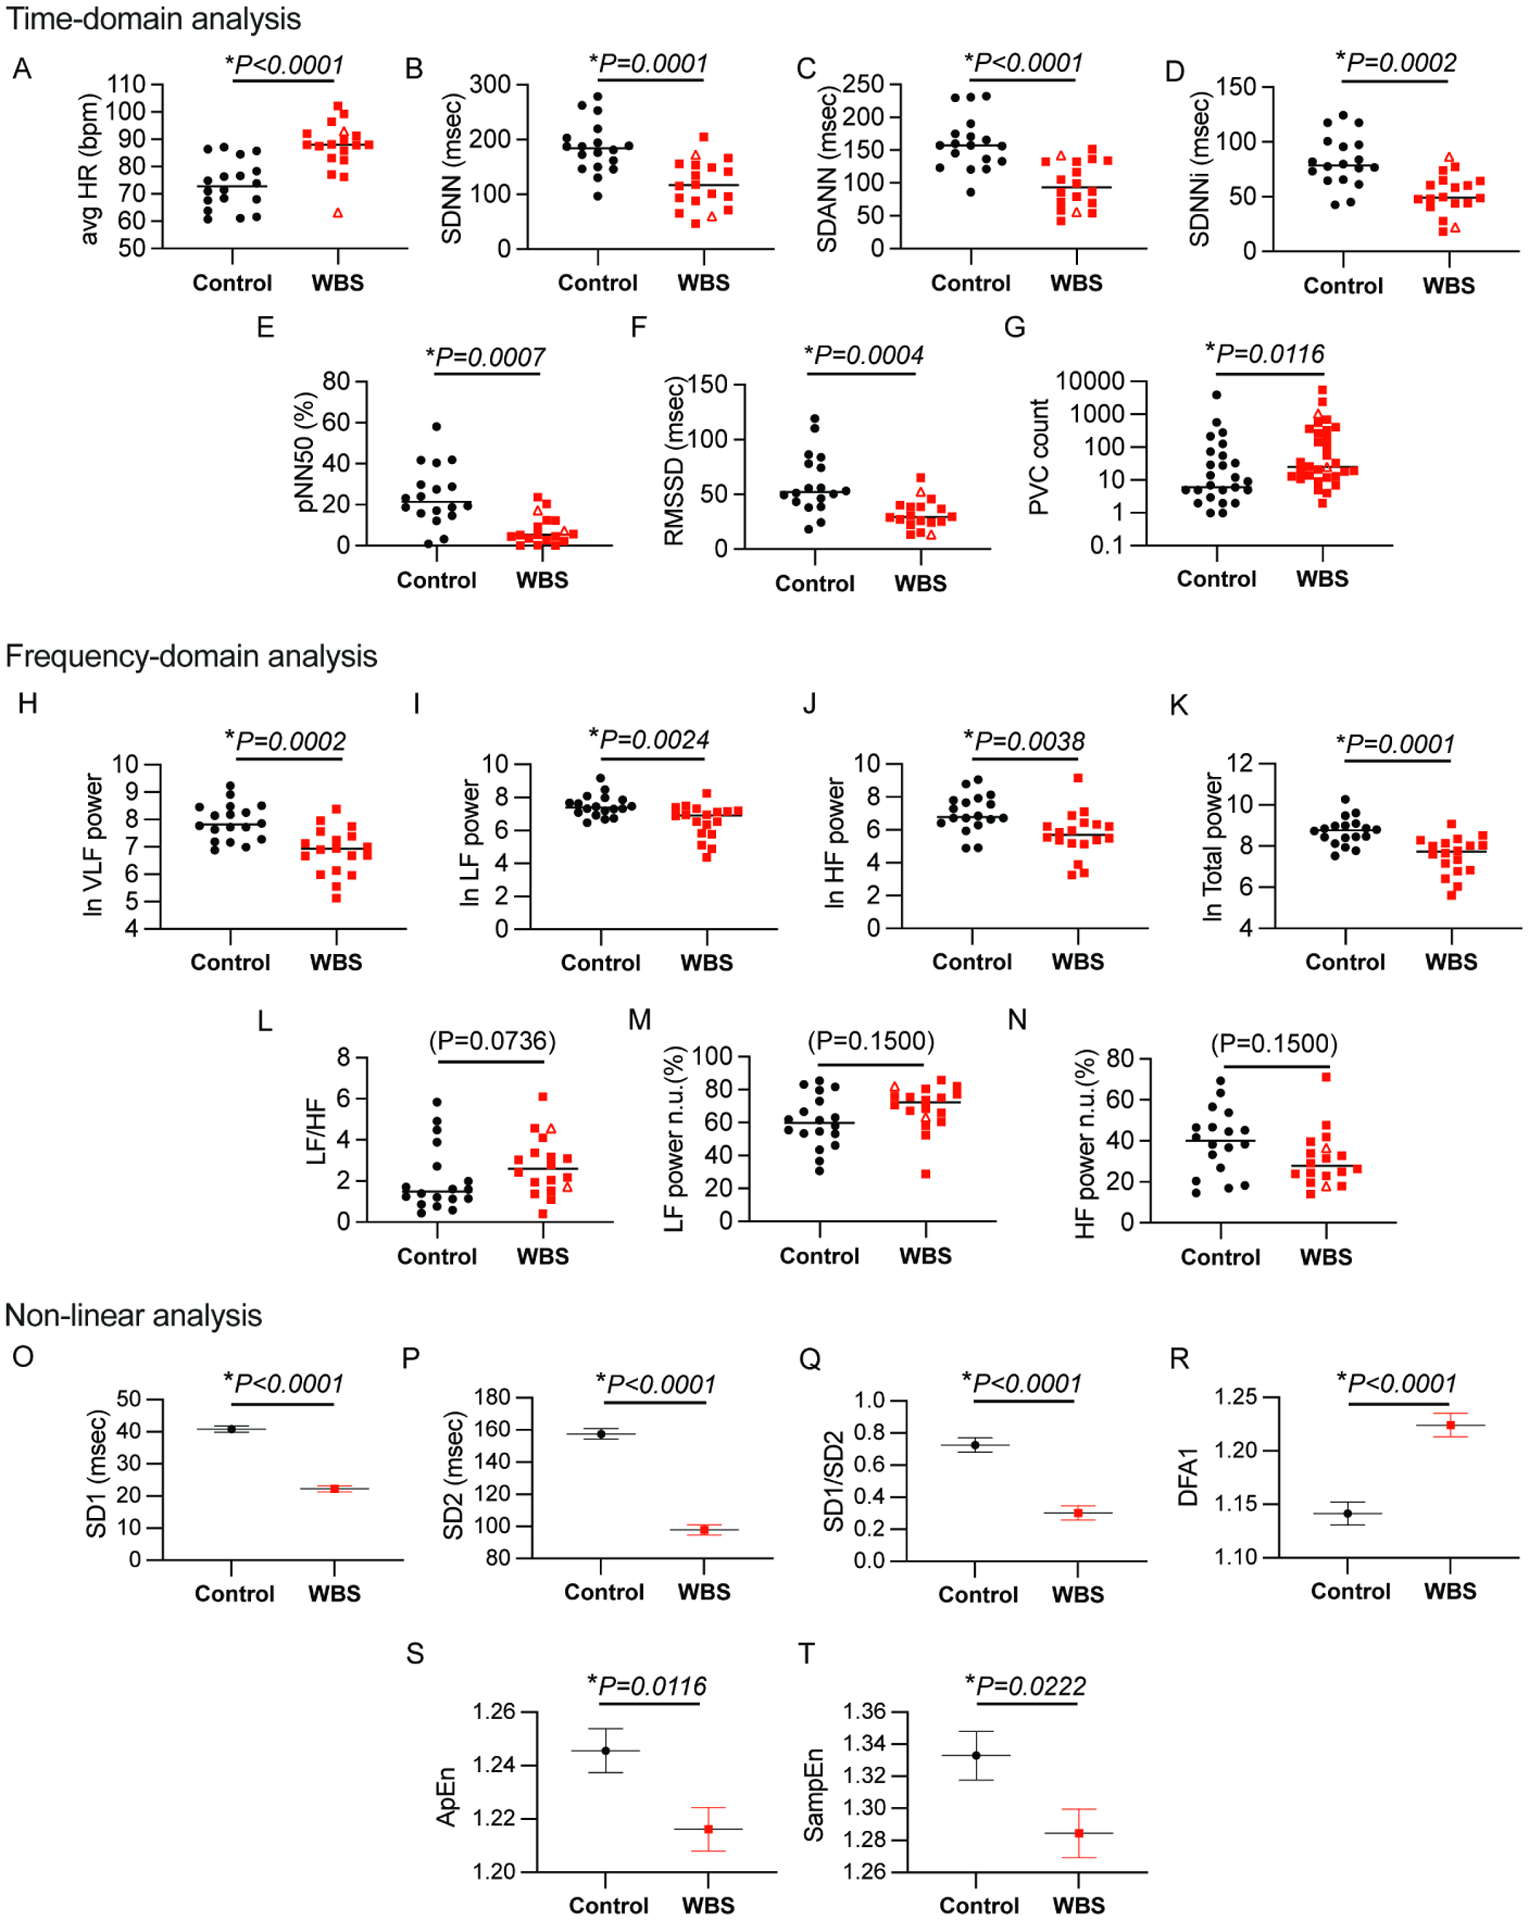
Figure 1. WBS subjects display significant autonomic dysregulation as measured by non-linear, time- and frequency-domain HRV analyses from 24hr ECG recordings.

Scatter plots comparing WBS subjects (n=18) and controls (n=18) shown for the following: (1)Time-domain analysis derived from 24 hour data segments: (A)Avg HR (B)SDNN (C)SDANN (D)SDNNi (E)pNN50 (F)RMSSD, (G)PVC count (2)Frequency-domain analysis: (H)lnVLF power (I)lnLF power (J)lnHF power (K)lnTotal Power (L)LF/HF ratio (M) LF power (normalized) (N) HF power (normalized) comparing control and WBS subject cohorts. Mann-Whitney test were performed for comparisons of data not transformed by natural log and unpaired parametric T-tests were performed where data has been transformed by the natural log. (derived from 24hour data segmented into 5 minute intervals) (3)Non-linear analyses using mixed-effect model on 24hour data segmented into 1 hour intervals: (O)SD1, (P)SD2, (Q)SD1/SD2, (R)DFA1, (S)ApEn and (T)SampEn comparing control and WBS subject cohorts. Graphs display median for non-transformed data, mean for transformed data and estimated mean±standard error for mixed model effect data. P-values displayed for all parameters. WBS subjects who underwent CT surgery are displayed as open triangles, while WBS subjects not requiring cardiac surgical palliation are displayed as filled squares.
