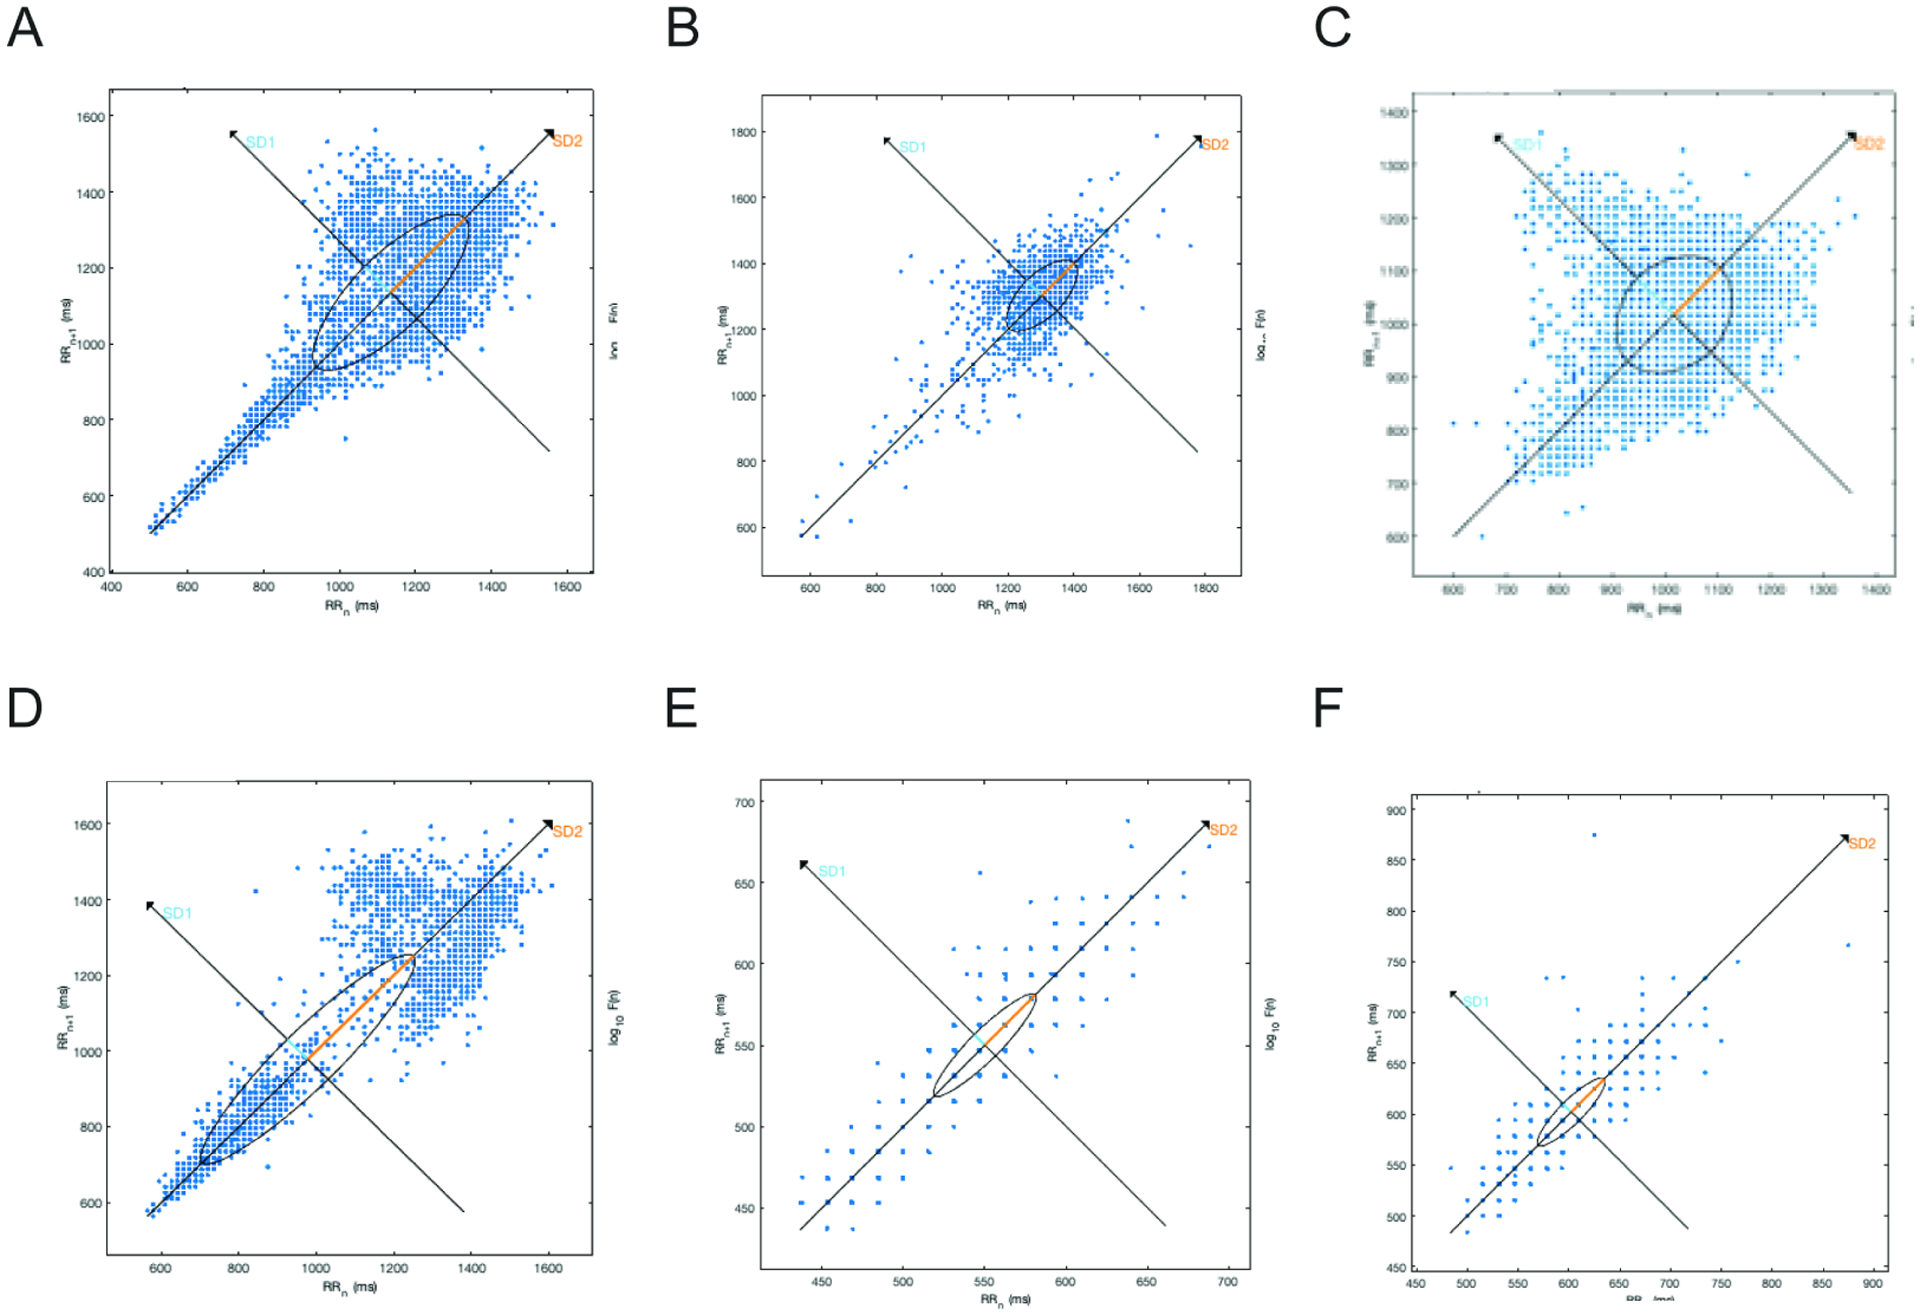
Figure 3. Poincaré plot morphologic evaluation from hourly segmented data.

Poincare plots constructed from hourly-segmented data showing: (A) “comet-like” morphology (typical, considered normal) (B) ”ball-like” plot (C) asymmetric “complex” plot and (D) bimodally distributed plot (A-D from controls); Two examples of “torpedo-like” plots from subjects (E) and (F). Eleven of eighteen subjects showed 2 or more torpedo-shaped plots, while no control showed such. Axis scales are not uniform.
