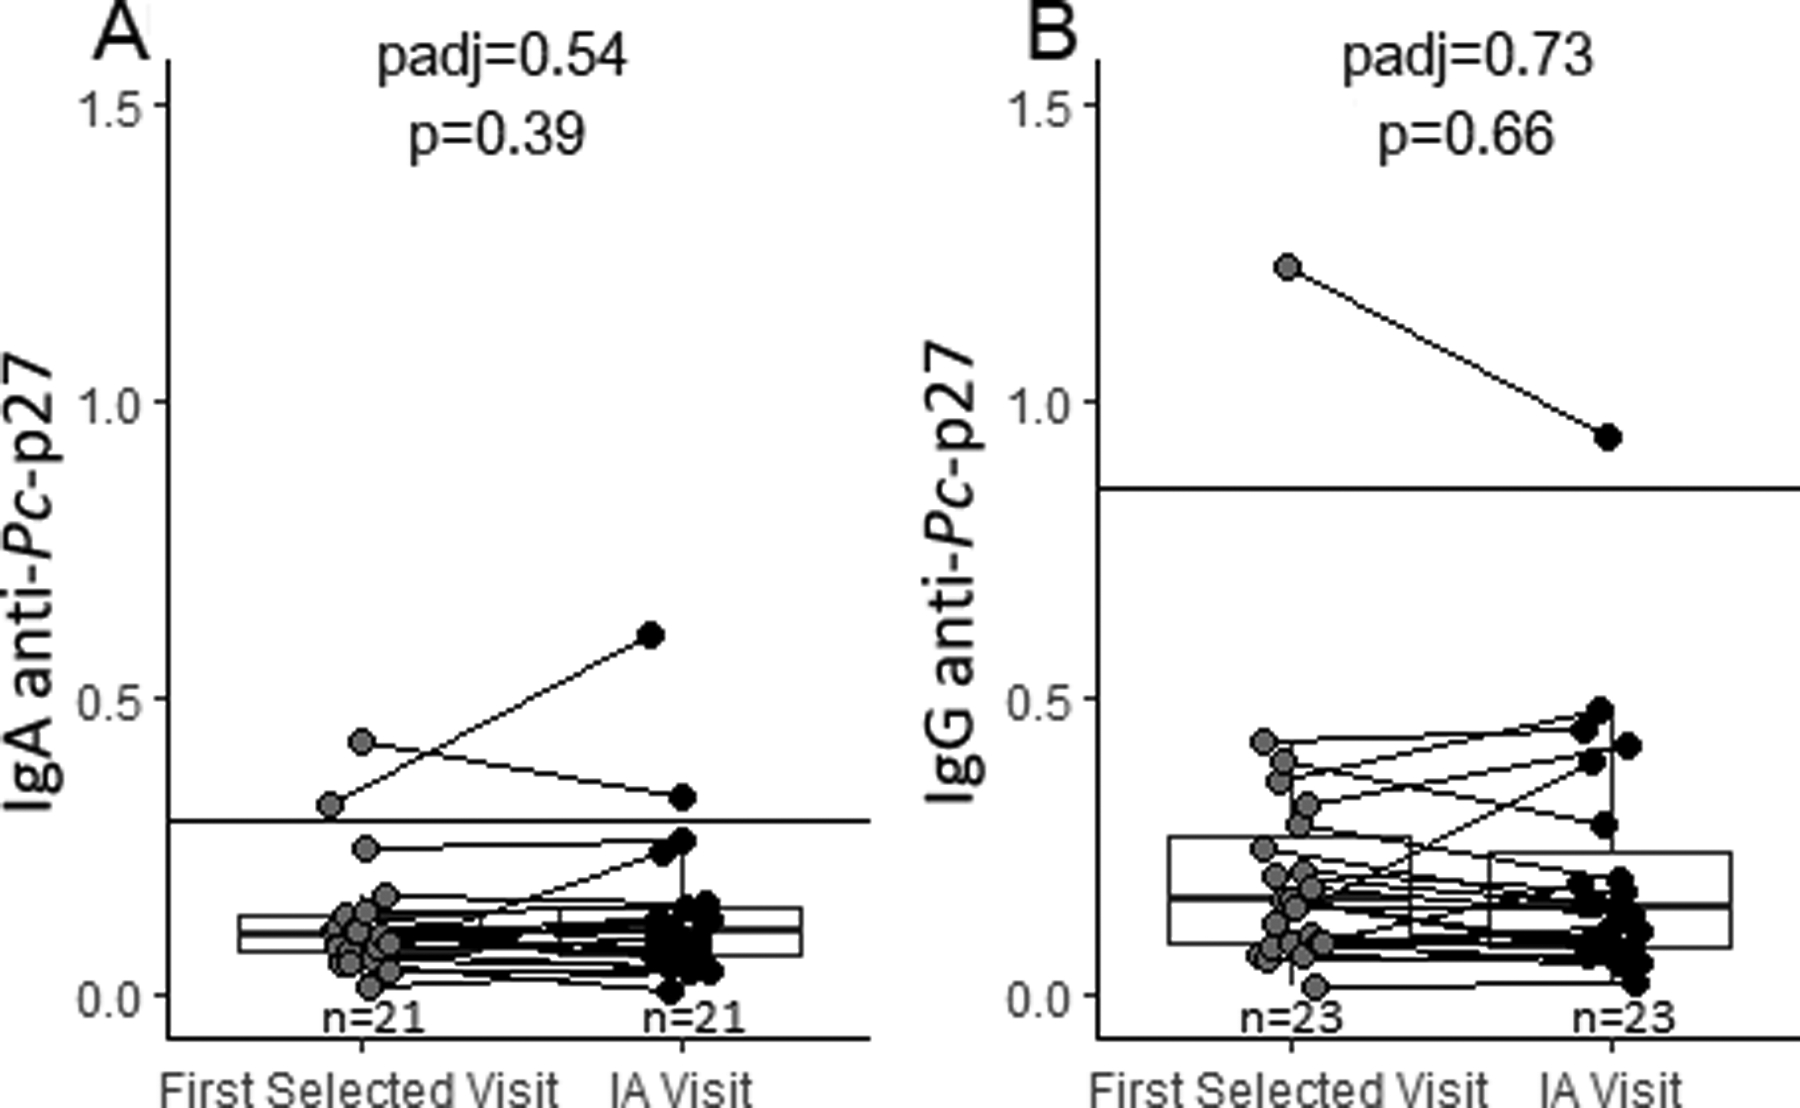
Figure 3.

Longitudinal analysis of IgA and IgG anti-Pc-p27 among participants who transitioned to IA during follow-up. The solid line on each plot represents the positive cutoff. 3A, levels of IgA anti-Pc-p27 did not significantly change from the first selected study visit to the study visit where IA was determined. 3B, levels of IgG anti-Pc-p27 did not significantly change from the first selected study visit to the study visit where IA was determined.
