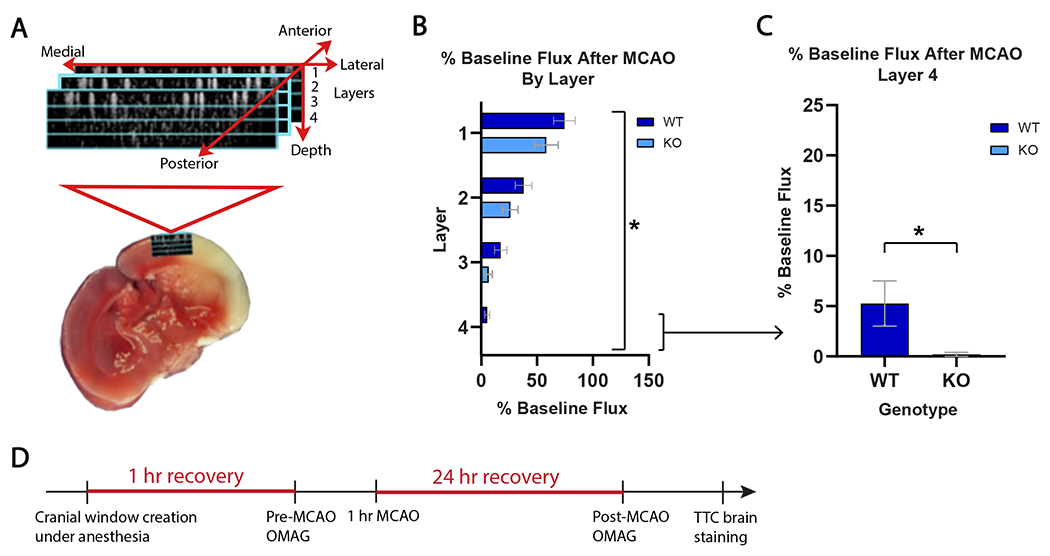
Figure 3. Optical microangiography (OMAG) demonstrates worsened microvascular brain tissue perfusion in GPR39 KO vs WT males after stroke.

A. Schematic of OMAG setup for capillary blood flow measurement in 4 cortical layers within ischemic penumbra. B. Post-stroke cortical capillary flux in in layers 1-4 (% baseline) in GPR39 KO (n=10) and WT littermates (n=11). (Genotype F1,76 = 5.36; *p<0.0234). C. Post-stroke capillary flux in GPR39 KO vs. WT littermates in deepest cortical layer only (#4). (n=10 KO, n=11 WT, *p<0.05). D. Experimental timeline illustrating OMAG timing relative to MCAO. Mice were allowed 1 hour of recovery after cranial window creation under anesthesia prior to baseline OMAG scan. Mice were then subjected to MCAO, and recovered for 24 hours when they underwent a second post-stroke OMAG scan. Brains were collected, sectioned and stained with TTC to measure infarct size.
