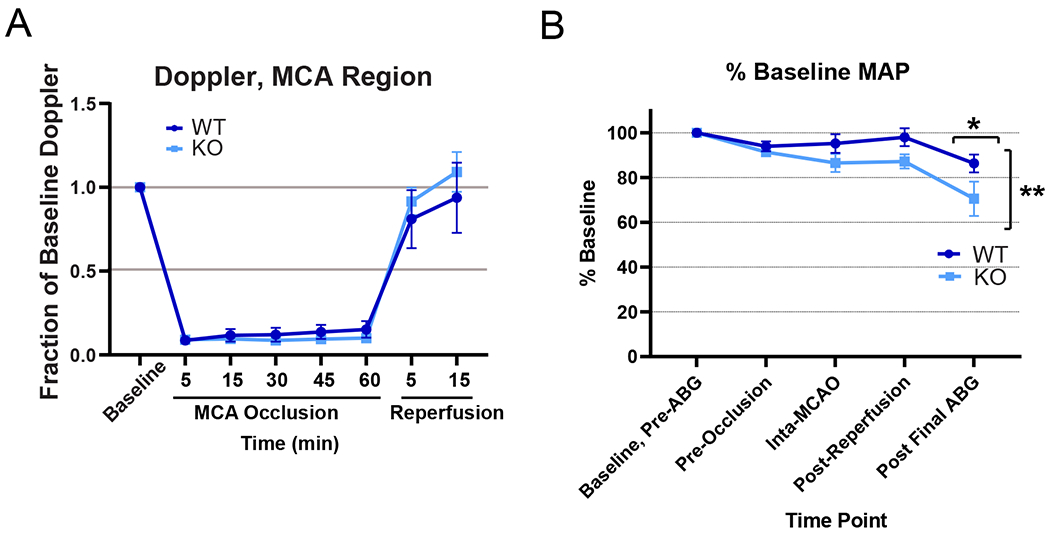
Figure 5. Hemodynamic measures in GPR39 KO and WT mice during and after stroke.

A. Relative laser-Doppler perfusion over the MCA territory during and 15 min after MCAO, n.s. not significant. B. Mean arterial pressure (MAP), as % baseline, in cohort used for arterial blood gas measurement. (Genotype F1,32 = 10.05; **p<0.0034; post final ABG adjusted p value for multiple comparisons *p<0.05; n=5 per group).
