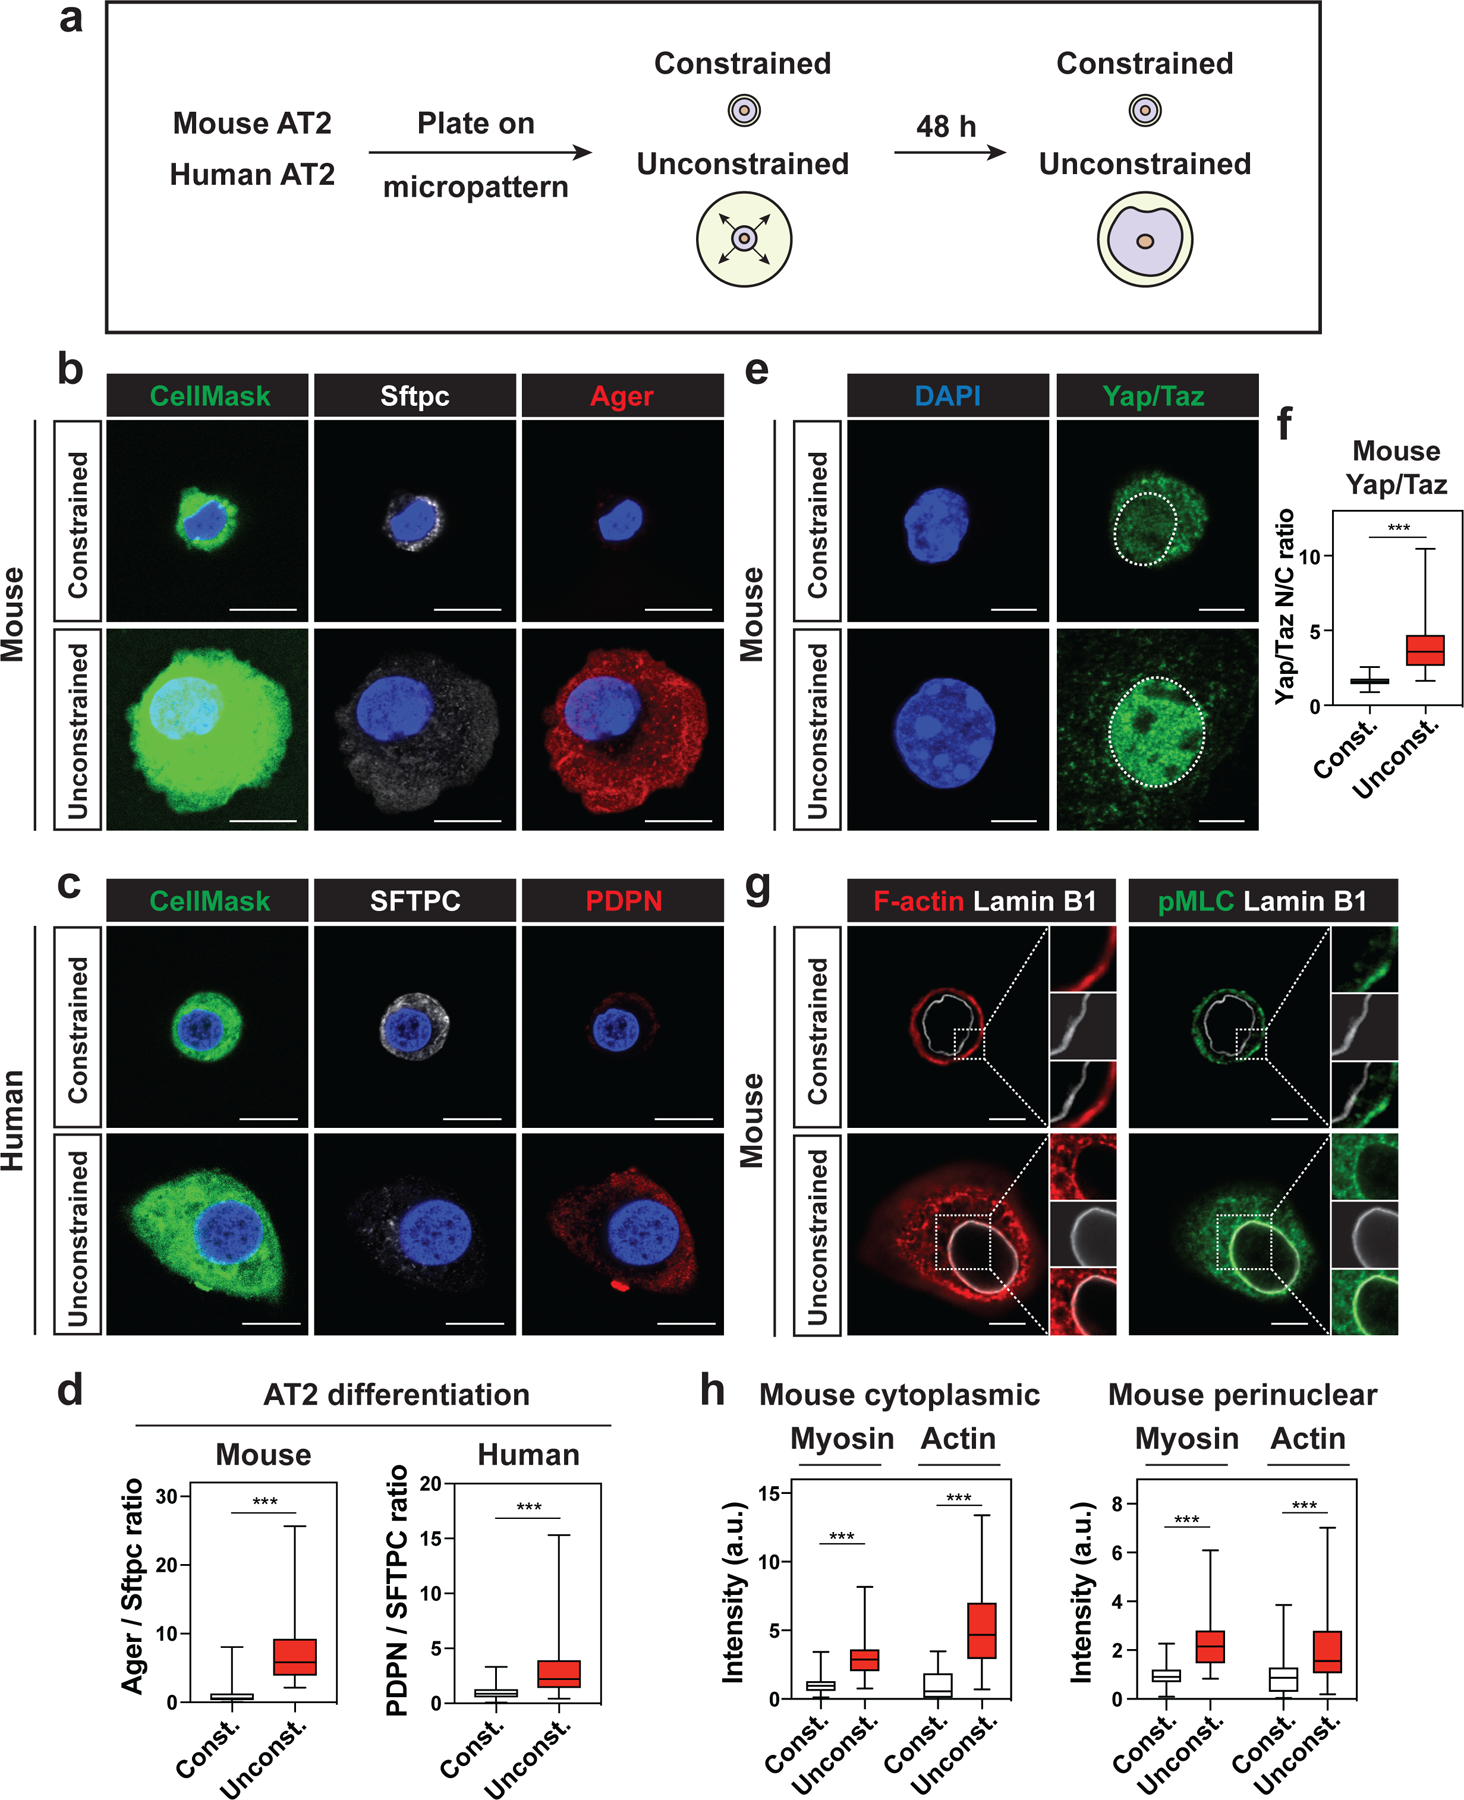
Figure 3. Cell spreading determines AT2-AT1 cell differentiation.

a. Mouse and human AT2 cells were cultured 48 h on micropatterned dishes with printed circles of different sizes.
b-c. Constrained AT2 cells do not differentiate into AT1 cells. Constrained mouse AT2 cells (10 μm circle) maintain Sftpc expression, while unconstrained mouse AT2 cells (> 20 μm circle) downregulate Sftpc and express AT1 cell marker Ager (b). CellMask is used to visualize the cell body. Constrained human AT2 cells maintain SFTPC expression, while unconstrained human AT2 cells downregulate SFTPC and express AT1 cell marker PDPN (c).
d. Ager/Sftpc ratio representing mouse AT2-AT1 cell differentiation was quantified with n = 145 constrained and n = 164 unconstrained AT2 cells pooled from 4 independent experiments (left). PDPN/SFTPC ratio representing human AT2-AT1 cell differentiation was quantified with n = 122 constrained, n = 106 unconstrained AT2 cells pooled from 3 independent experiments (right).
e-f. Yap/Taz localize to unconstrained mouse AT2 nucleus, but not to constrained AT2 nucleus (e). Yap/Taz nuclear to cytoplasm ratio was quantified with n = 131 constrained and n = 166 unconstrained mouse AT2 cells pooled from 4 independent experiments (f). g-h. Actin fibers and activated myosin are abundant in cytoplasm and perinuclear regions of unconstrained AT2 cells (g). Actin and myosin intensity in cytoplasmic and perinuclear regions were quantified with n = 33 constrained and n = 36 unconstrained mouse AT2 cells (h).
*** P < 0.001 by two-tailed t-test. For Box and whisker plots, bars represent min and max values. Scale bars: b, c, 10 μm; e, g, 2.5 μm. See also Figures S4 and S5.
