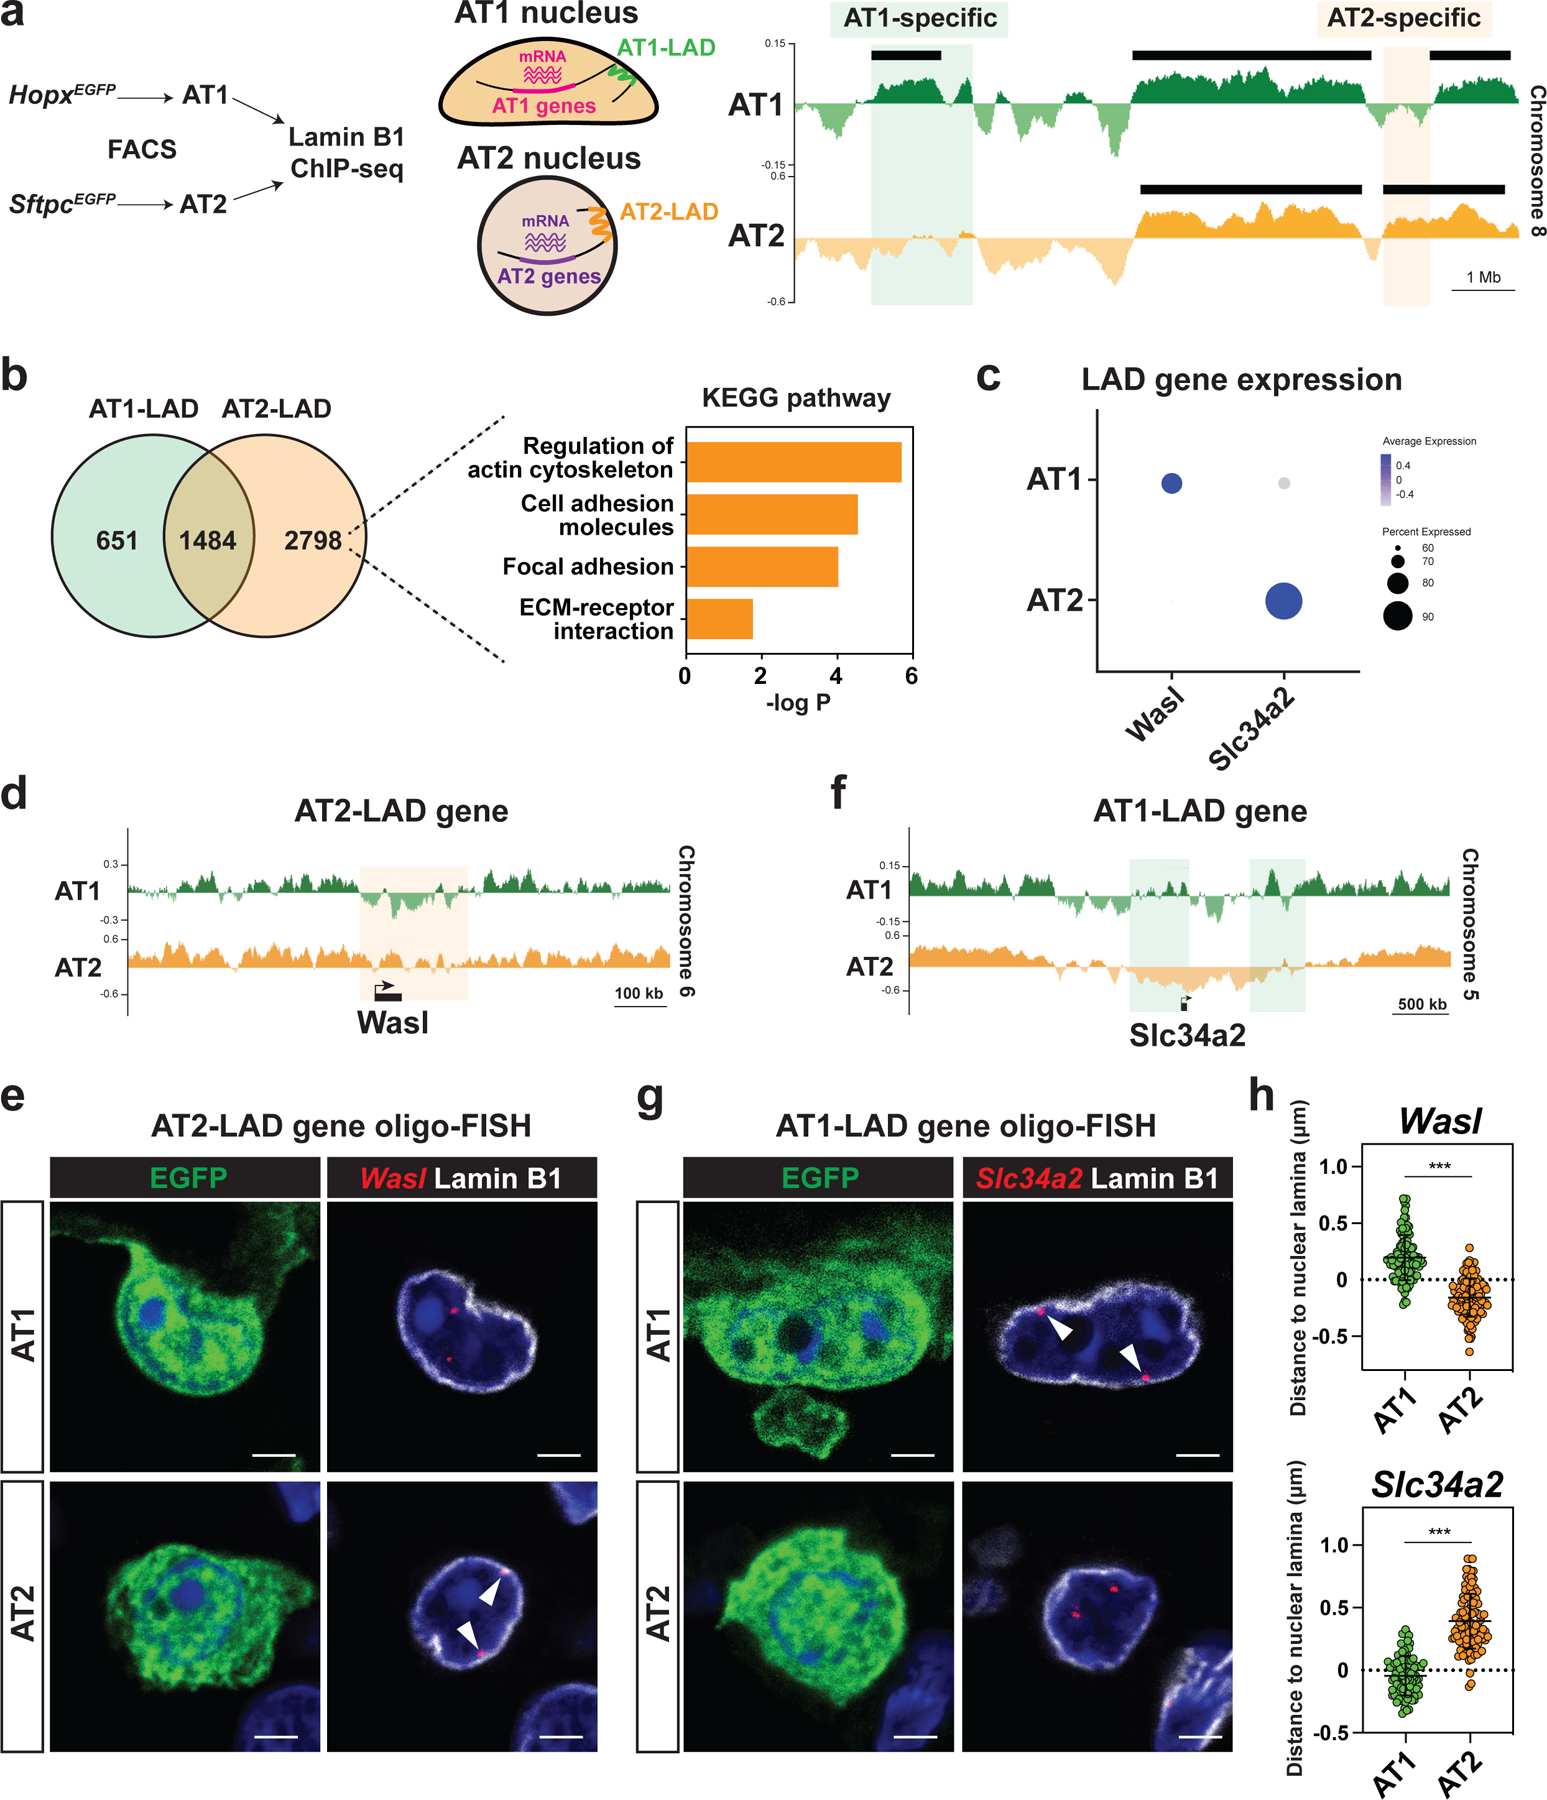
Figure 5. Nuclear lamina-chromatin interactions discriminate alveolar epithelial cellular fate.

a. AT1 and AT2 cells were isolated from HopxEGFP (AT1) or SftpcEGFP (AT2) mice by fluorescence-activated cell sorting (FACS) and used for Lamin B1 ChIP-seq. Representative Lamin B1 ChIP-seq tracks (right) for AT1 and AT2 cells, showing AT1 and AT2-specific LADs. Black bars represent EDD-defined LADs.
b. Comparison of AT1 and AT2 LAD genes. Pathway enrichment analysis of AT2-LAD genes reveals an enrichment of genes associated with actin cytoskeleton and focal adhesion.
c. DotPlot showing LAD gene expression in AT1 and AT2 cells. scRNA-seq data obtained from this study were used.
d. Lamin B1 ChIP-seq tracks for AT1 and AT2 cells, showing that Wasl loses residence in AT1 cells.
e. Oligo-FISH of Wasl loci in lung sections from HopxEGFP AT1 and SftpcEGFP AT2 reporter mice. Arrowheads indicate Wasl locus.
f. Lamin B1 ChIP-seq tracks for AT1 and AT2 cells, showing that Slc34a2 loses residence in AT2 cells.
g. Oligo-FISH of Slc34a2 loci in lung sections from HopxEGFP AT1 and SftpcEGFP AT2 reporter mice. Arrowheads indicate Slc34a2 locus.
h. 3D Quantification of the distance between Wasl (n = 113 AT1 and n = 112 AT2 cells) or Slc34a2 (n = 101 AT1 and n = 112 AT2 cells) loci and Lamin B1. Imaris returned negative values when a FISH signal was embedded in the nuclear lamina.
*** P < 0.001 by two-tailed t-test. Each dot represents an individual cell, and error bars indicate mean with s.d. Scale bars: e, g, 2.5 μm. See also Figure S6.
