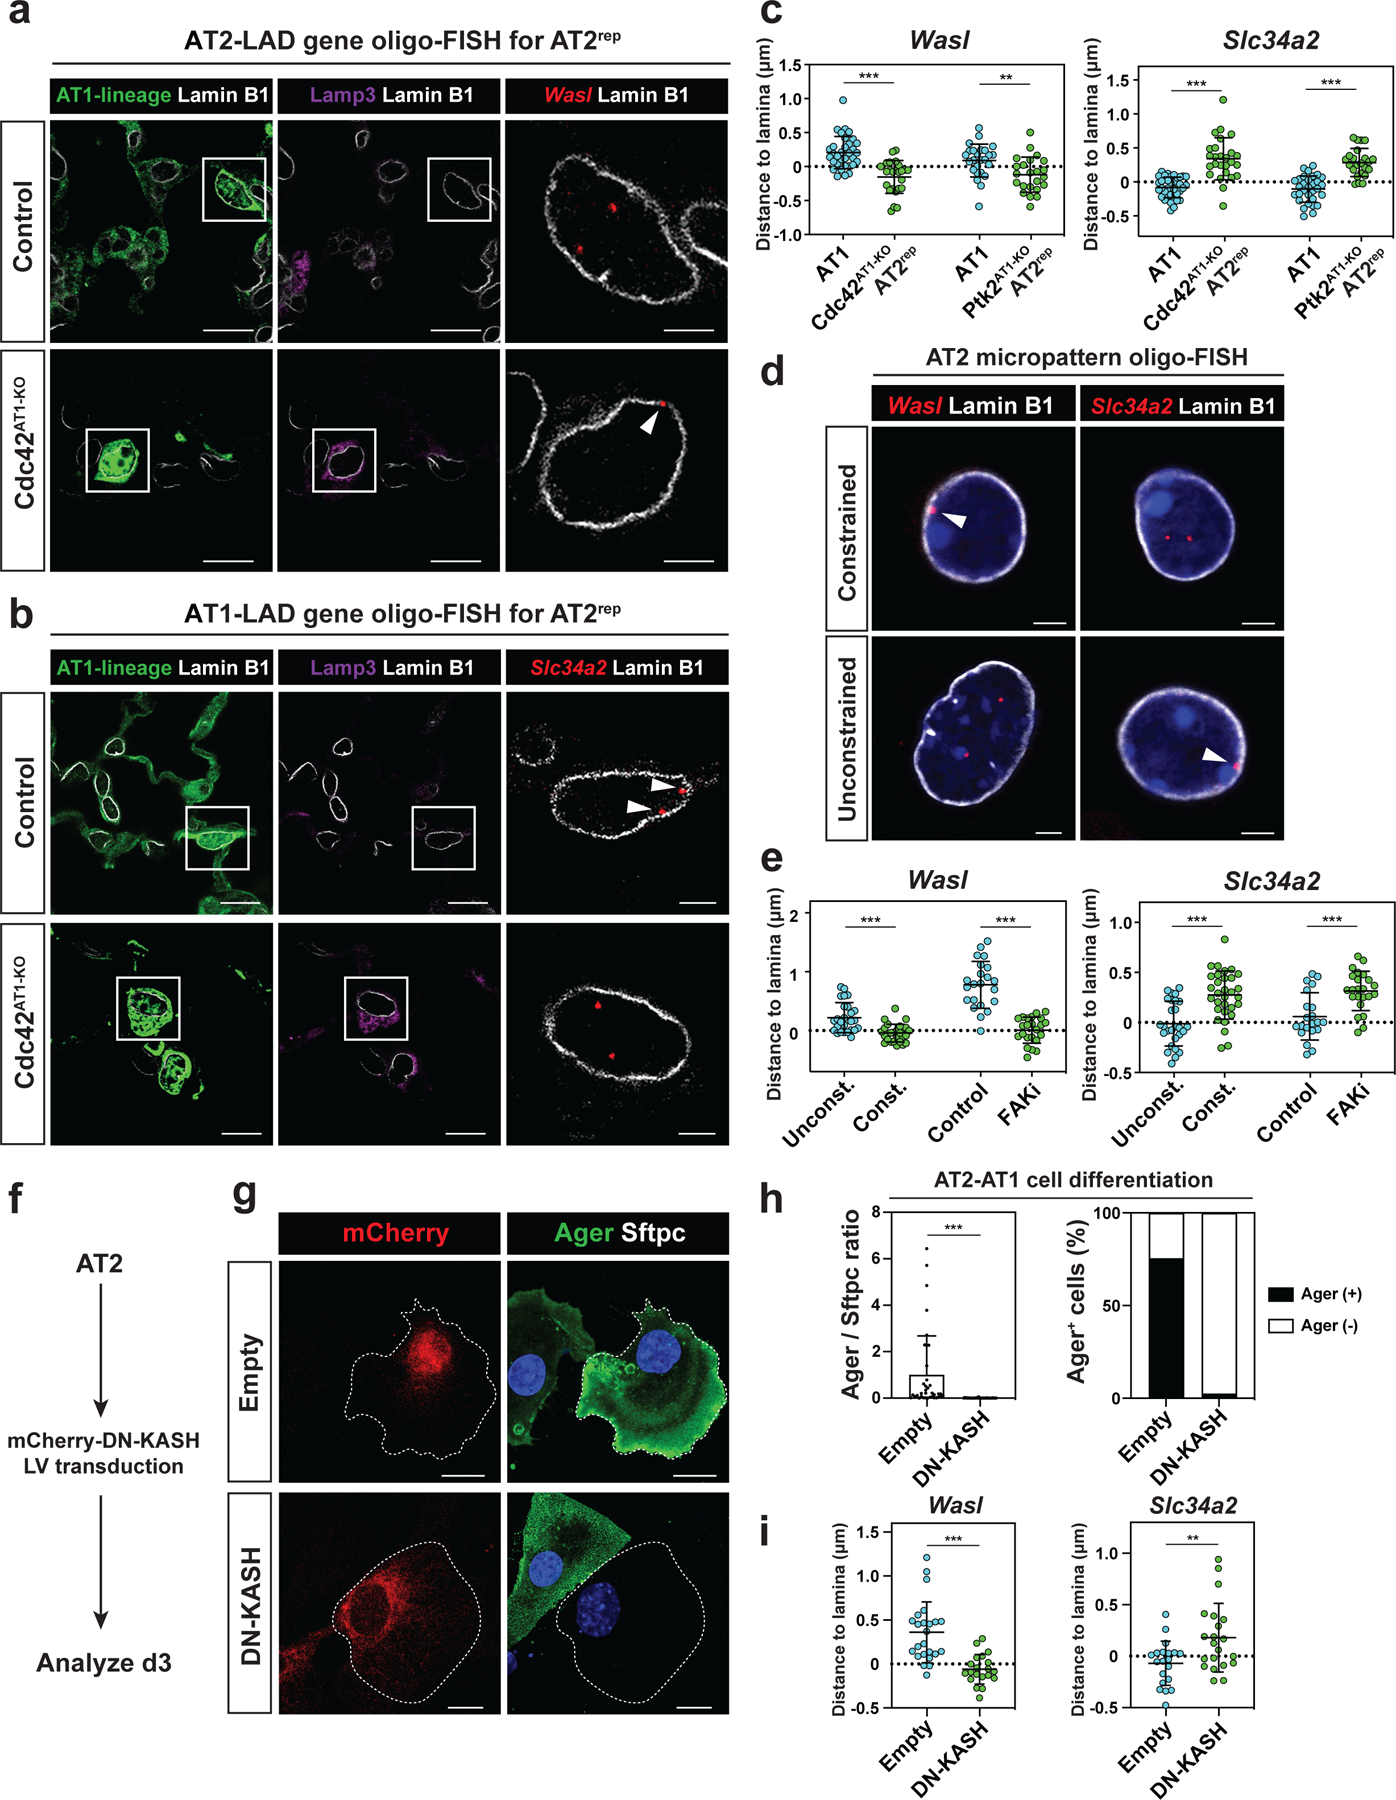
Figure 6. Alveolar epithelial fate changes involve LAD reorganization.

a-b. Oligo-FISH of Wasl (a) and Slc34a2 (b) loci in lung sections from control and Cdc42AT1-KO mice. Arrowheads indicate Wasl (a) or Slc34a2 (b).
c. Quantification of the distance between Wasl (n = 33 AT1 and n = 25 AT2rep cells for Cdc42AT1-KO, and n = 25 AT1 and n = 23 AT2rep cells for Ptk2AT1-KO) or Slc34a2 (n = 36 AT1 and n = 26 AT2rep cells for Cdc42AT1-KO, and n = 31 AT1 and n = 23 AT2rep cells for Ptk2AT1-KO) loci and Lamin B1 for control AT1 and AT2rep cells.
d. Oligo-FISH of Wasl and Slc34a2 loci for AT2 cells from micropattern experiments. Arrowheads indicate Wasl (left) or Slc34a2 (right).
e. Quantification of the distance between Wasl (n = 26 constrained, n = 26 unconstrained, n = 22 untreated, and n = 23 FAK inhibitor-treated cells) or Slc34a2 (n = 31 constrained, n = 27 unconstrained, n = 21 untreated, and n = 23 FAK inhibitor-treated cells) loci and Lamin B1.
f. Primary AT2 cells were transfected with lentivirus containing dominant-negative KASH and analyzed on day 3.
g-h. Dominant-negative KASH inhibits AT2 cell differentiation (g). Quantification of Ager/Sftpc ratio and Ager+ cell ratio from n = 37 control vector-transfected and n = 40 dominant-negative KASH-transfected cells from n = 3 experiments (h).
i. Quantification of the distance between Wasl (n = 24 control and n = 20 dominant-negative KASH-transfected cells) or Slc34a2 (n = 20 control and n = 21 dominant-negative KASH-transfected cells) loci and Lamin B1 from n = 3 experiments.
*** P < 0.001 and ** P < 0.01 by two-tailed t-test. Each dot represents an individual cell, and error bars indicate mean with s.d. Scale bars: a (left and middle), b (left and middle), g, 10 μm; a (right), b (right), d, 2.5 μm.
