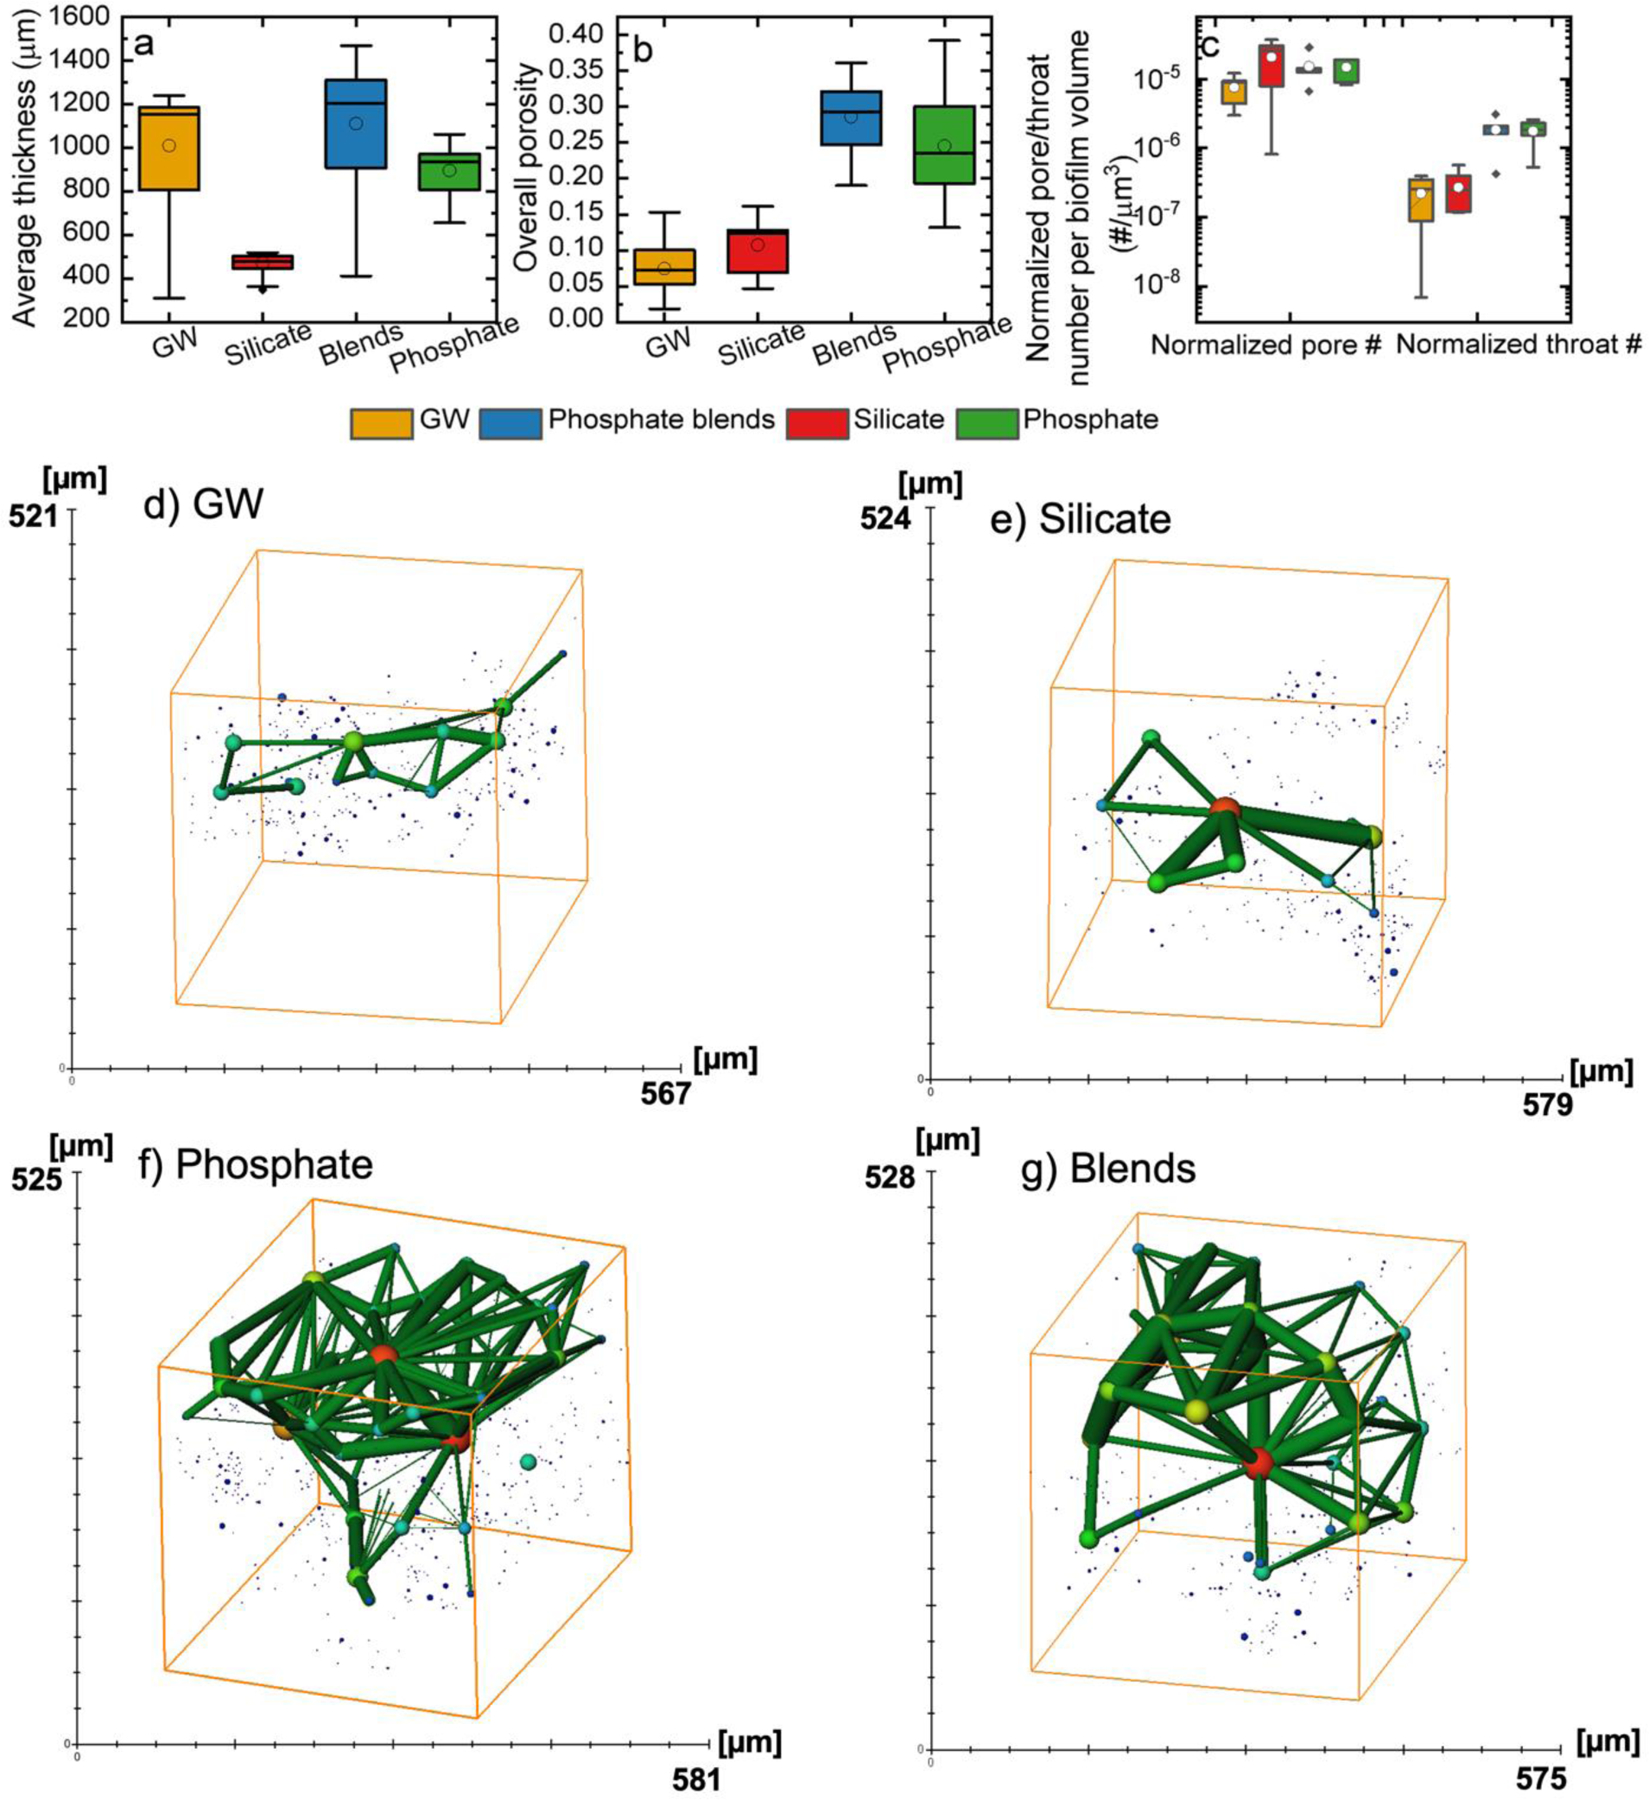
Figure 1.

Biofilm mean absolute thickness (a) (N = 195–673) and mean overall porosities (b) (N = 13–24) in the 720 µm surface layer of groundwater (yellow), silicate (red), phosphate blends (blue), and phosphate (green) biofilms. c) Distributions of normalized pore or throat number per biofilm volume (N = 5–7) in groundwater (yellow), silicate (red), phosphate blends (blue), and phosphate (green) biofilms. The pore network (spherical pores connected with cylindrical throats) obtained from the reconstructed pore space from (d) groundwater, (e) silicate, (f) phosphate, and (g) phosphate blends biofilms. The solid lines in the boxes marked the medians in the distributions. The boxes marked 25 to 75% of the percentile in the measurements. The whiskers are 1.5 interquartile range (IQR). Solid points are outliers and opened circles are means.
