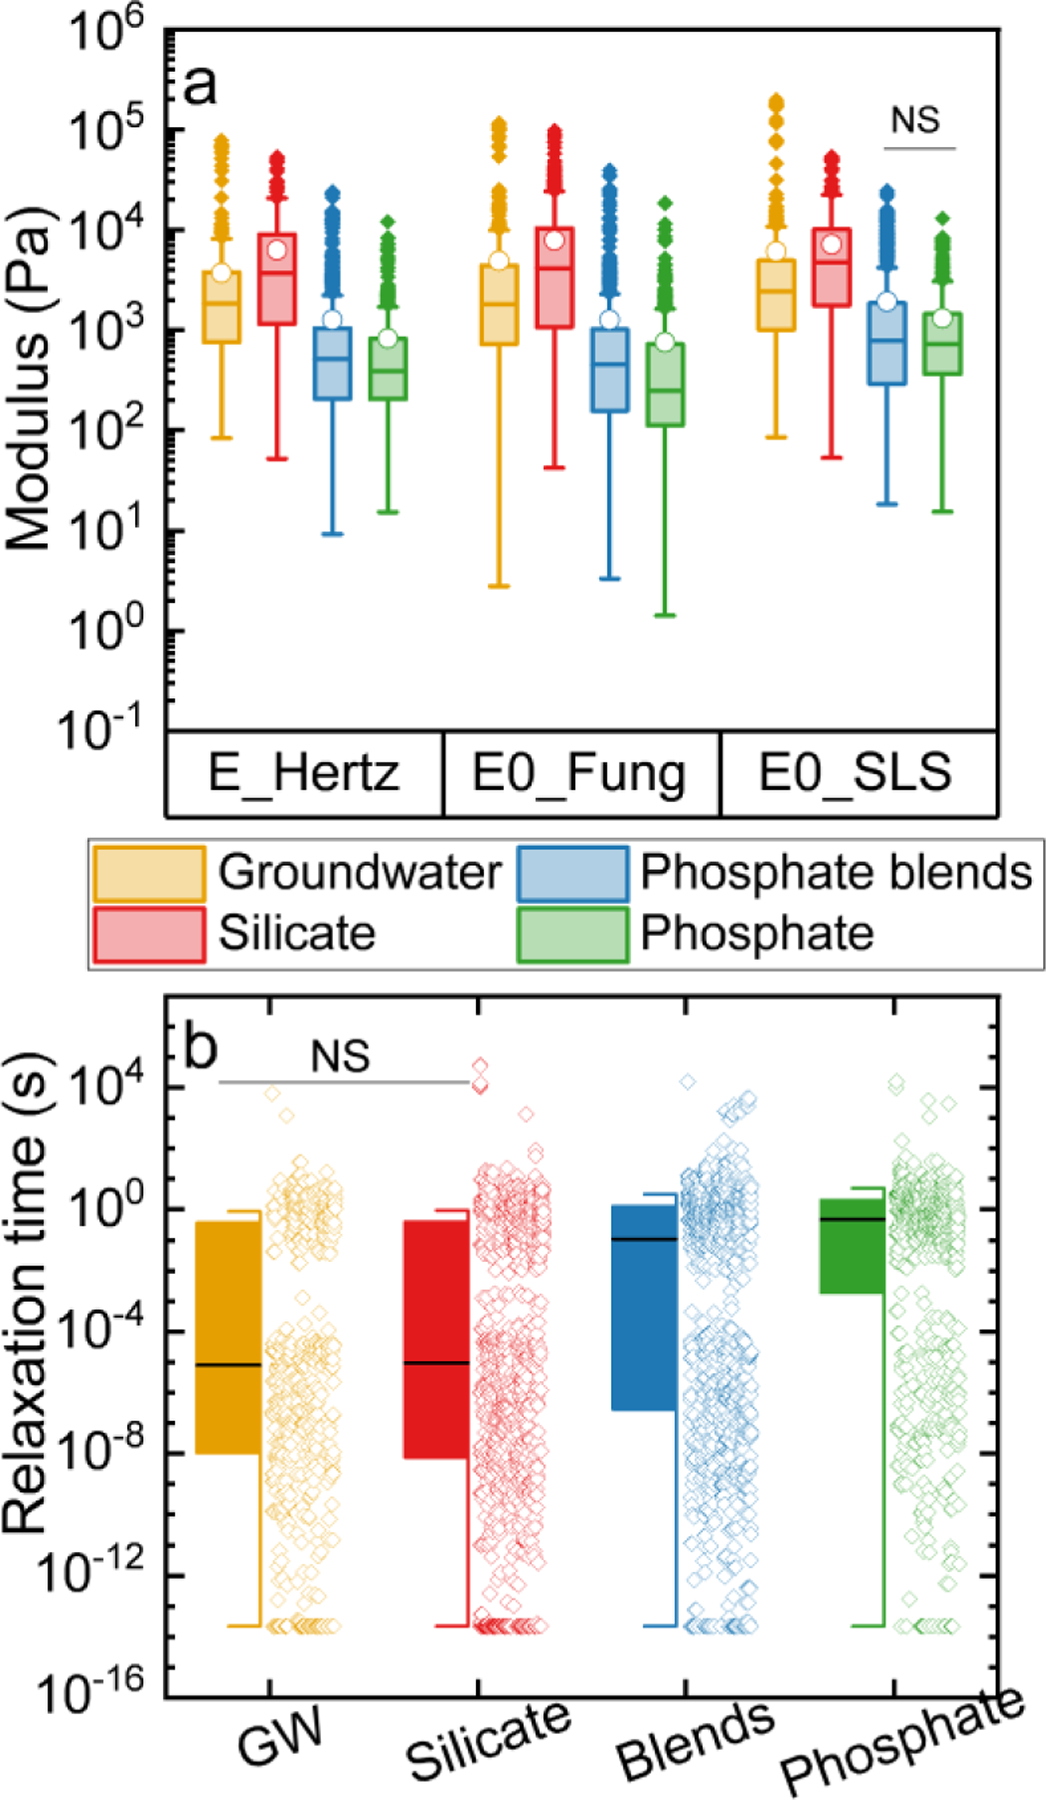
Figure 2.

a) Distributions of Young’s modulus obtained by the Hertz model and instantaneous modulus obtained by the Fung model and SLS model (N = 633–1117). The solid lines in the boxes marked the medians in the distributions. The boxes marked 25 to 75% of the percentile in the measurements. The whiskers are 1.5 interquartile range (IQR). Solid points are outliers. NS indicates that no significant differences (p > 0.05) were found in the hypothesis test. b) Distributions of relaxation times obtained from the SLS model are shown for groundwater (yellow), silicate (red), phosphate blends (blue), and phosphate (green) biofilms (N = 633–1117). Solid black lines are medians of the relaxation times. Open circles are the relaxation time data points. Solid boxes mark the 25 to 75% percentiles of the relaxation time. The whiskers are 1.5 interquartile range (IQR). NS indicates that no significant differences (p > 0.05) were found in the hypothesis test.
