Figure 3.

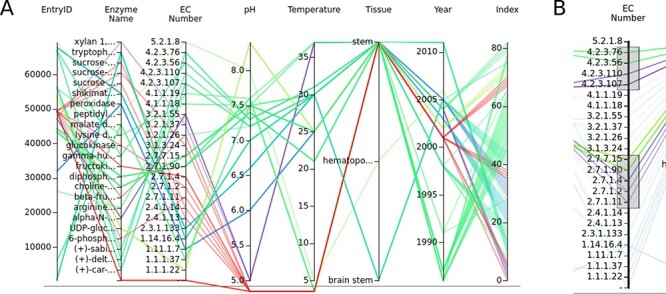
(A) The parallel coordinates graph of the entry data. Attribute names are given above the graph. One entry represents one line on the graph. Null values are under the lower line. (B) Data can be selected by brushing the axes.

(A) The parallel coordinates graph of the entry data. Attribute names are given above the graph. One entry represents one line on the graph. Null values are under the lower line. (B) Data can be selected by brushing the axes.