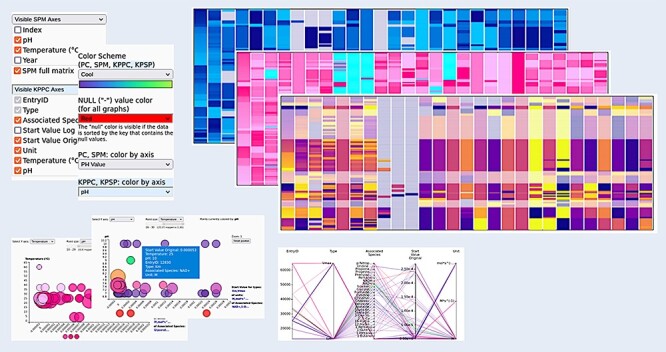
Figure 8.

Customizing the graphs. All graphs can be visually adjusted by determining what exactly is shown within the graphs (choose the axes), by reordering the data and by selecting different color schemes for the visualizations, making the appearance adjustable to the needs of the user.
