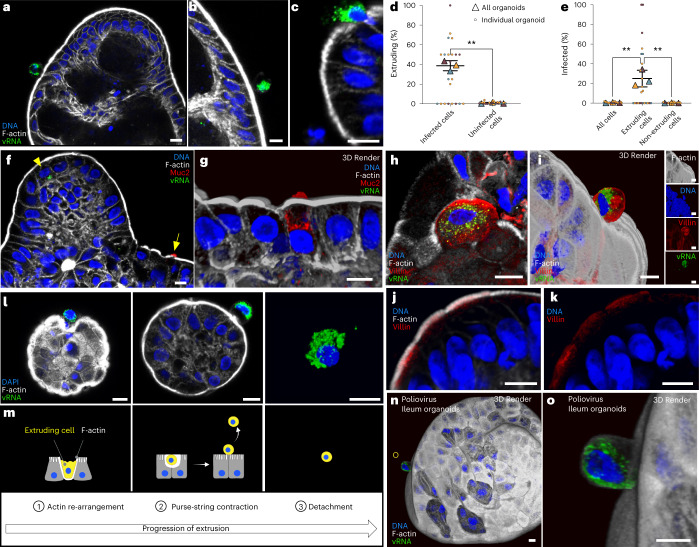
Fig. 2. Specific extrusion of EV-A71-infected cells from colonoids.
a–c, Infected colonoids were fixed at 48 h post infection and stained for double-stranded vRNA. d, Infected cells were extruded from colonoids with higher frequency than uninfected cells. The percentages of infected or uninfected cells extruding from an individual organoid are shown as small circles. The proportion of cells extruding across all organoids in each experiment are shown as triangles of the same colour as the individual colonoids. At least ten organoids were quantified per experiment: **P < 0.01; paired, two-tailed t-test, N = 3 experiments. e, Percentages of infected extruding and non-extruding cells were measured similarly. Of the cells that were extruding, a higher percentage was infected. **P < 0.01; repeated measures one-way ANOVA with Tukey’s multiple comparisons test, N = 3 experiments. In d and e, raw cell numbers represented in the graphs are displayed in Supplementary Table 1. f, EV-A71-infected colonoids were stained for Muc2 expression, a marker for goblet cells. Arrowhead indicates infected cell. Arrow indicates goblet cell shown in g. g, Muc2-expressing goblet cell. h,i, Villin expression identifies colonocytes. Villin localizes apically, overlapping with the actin-rich microvillus brush border. Distinct individual cells are shown. j,k, EV-A71-infected colonoids were stained for Villin expression. l, Representative extruding infected cells are shown. m, Stages of canonical cell extrusion in uninfected epithelia are depicted. n,o, Cells infected with poliovirus Type 1 (Mahoney) were observed extruding from ileum organoids by immunofluorescence. o shows an individual cell highlighted in n. Scale bars, 10 μm. In d and e, horizontal and error bars represent mean ± s.d.

