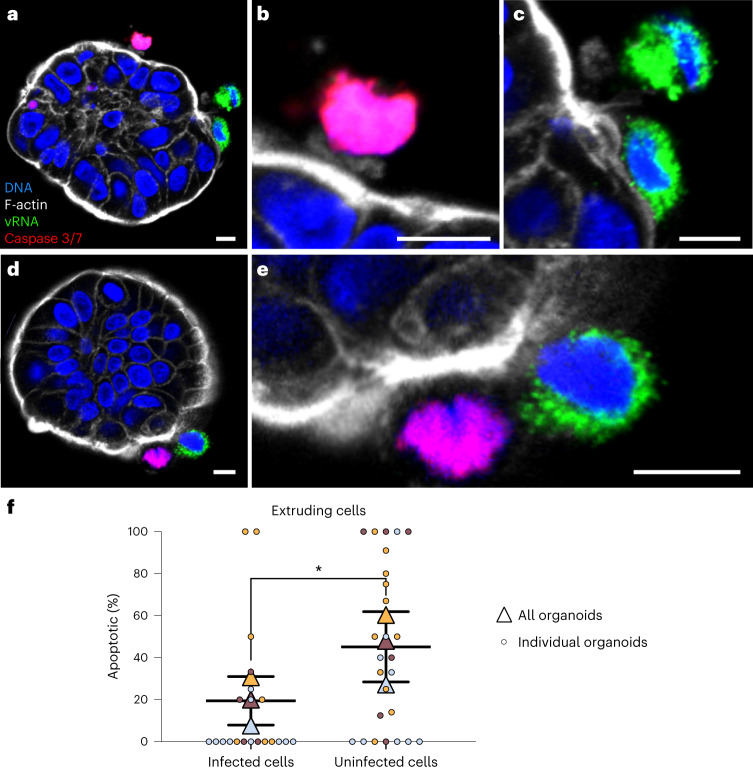
Fig. 3. EV-A71-infected cell extrusion is not driven by apoptosis.
Infected colonoids were visualized by immunofluorescence confocal microscopy after 48 h of infection. Caspase 3 and 7 activity was visualized using a fluorogenic substrate. a, Individual infected organoids with extruding cells. b, Increased magnification of single uninfected, apoptotic extruding cell in a. c, Increased magnification of two infected, non-apoptotic extruding cells in a. d, Individual infected organoids with extruding cells. e, Magnification of two extruding cells in d. f, Proportions of infected extruding and uninfected extruding cells that were apoptotic were quantified, with overall values for each experiment shown as triangles. Each colour represents an independent experiment, with measurements for each individual organoid shown as small circles. *P < 0.05; paired, two-tailed t-test, N = 3; horizontal and error bars represent mean ± s.d. Raw cell numbers represented in this graph are displayed in Supplementary Table 3. Scale bars, 10 µm.

