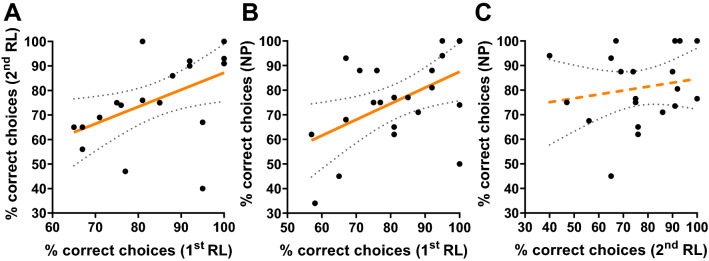
Fig. 3.
Correlations of the individual test performances in Experiment 2: Olfactory learning experiment with free-flying bees. Pairwise Spearman rank correlations between test performances (Percent of correct choices) of individual bees in A the 1st phase of reversal learning (1st RL) and the 2nd phase of reversal learning (2nd RL; n = 20, rho = 0.6, p = 0.006, R2 = 0.25), B the 1st phase of reversal learning and negative patterning (NP; n = 22, rho = 0.46, p = 0.03, R2 = 0.25) and C the 2nd phase of reversal learning and negative patterning (n = 20, rho = 0.19, p = 0.41, R2 = 0.03). Each dot represents the data of one bee. A regression line is indicated in orange and the dotted lines show the 95%-confidence intervals of the regression. Solid regression lines indicate a significant correlation and dashed lines indicate a non-significant correlation (color figure online)

