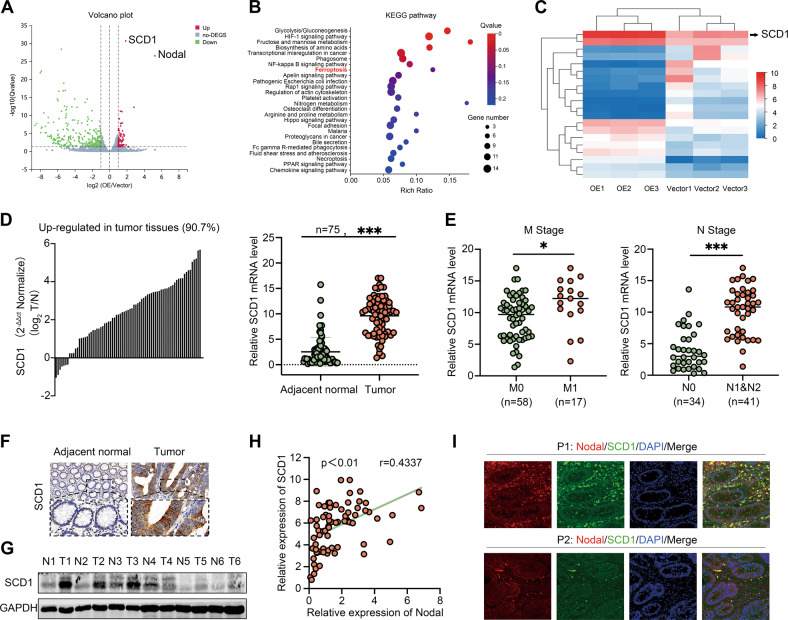
Fig. 3. SCD1 may be the potential downstream gene of Nodal.
RNA-sequencing was performed using HCT116 cells stably overexpressing Nodal and control cells. The experiment was repeated thrice for each cell type. A Volcano map demonstrating the distribution of DEGs in HCT116 cells in the vector/oe-Nodal group. B Kyoto Encyclopaedia of Genes and Genomes (KEGG) enrichment analysis showed the signalling pathways that were most enriched by significantly differentially expressed genes. C Heatmap demonstrating the relative protein abundance. D The mRNA expression of SCD1 in 75 CRC tissues and their adjacent normal tissues was quantified via a qRT-PCR. E Correlation between SCD1 expression and the metastasis and node stages in the collected CRC samples. F Representative images of IHC staining for SCD1 in CRC tissues and their adjacent normal tissues (magnification, × 200). G Western blotting was performed to examine the protein expression of SCD1 in six pairs of CRC tissues. H Pearson correlation analysis of the correlation between SCD1 and Nodal expression in the collected CRC samples. The relative expression level was calculated by using the 2-△△CT method. I Dual IF assay showed the expression and distribution of the SCD1 (green) and Nodal (red) in two CRC tissues (magnification, 200×). (∗P < 0.05 and ∗∗∗P < 0.001).

