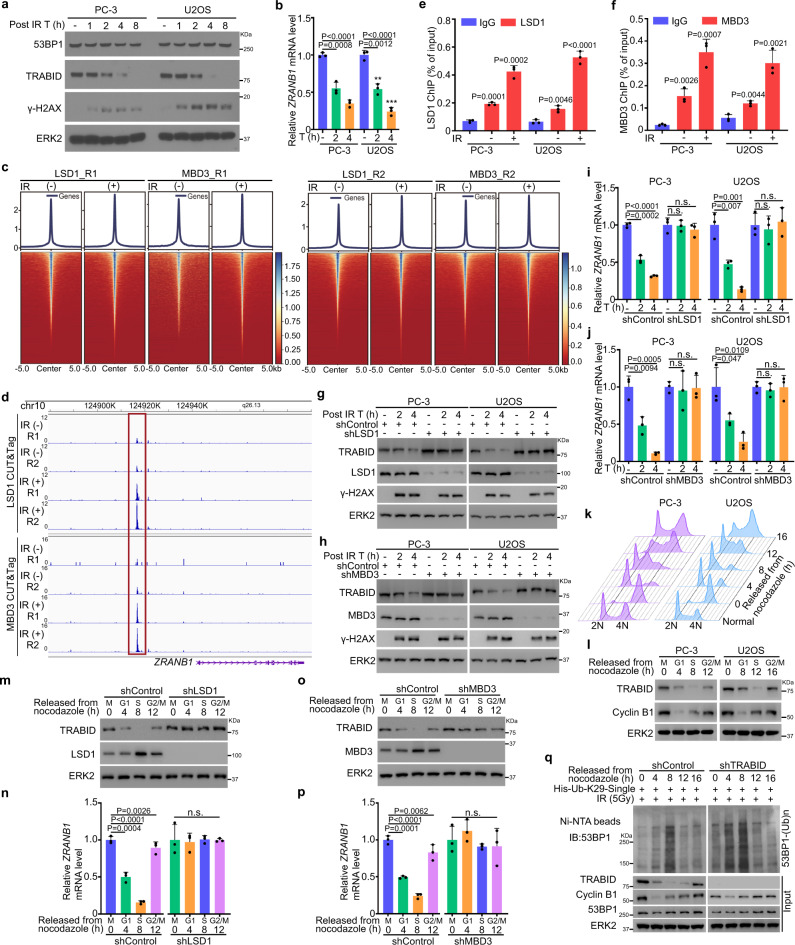
Fig. 4. TRABID is transcriptionally repressed by the NuRD complex after IR.
a PC-3 and U2OS cells were treated with IR and harvested at the indicated time points (T) after IR for WB analysis. b PC-3 and U2OS cells were treated with or without IR and harvested at the indicated time points after IR for RT-qPCR analysis. Data were shown as the mean ± SD of three independent experiments (n = 3). Two-tailed unpaired Student’s t-test. P values based on the order of appearance: 0.0008, 3.3E-5, 0.0012, and 9.5E-5. c Heatmaps show LSD1 and MBD3 CUT&Tag profiling sequencing read intensity throughout the genome in PC-3 cells with or without IR treatment. d CUT&Tag signal tracks showing LSD1 and MBD3 occupancy at ZRANB1 gene locus in PC-3 cells with or without IR treatment. e, f ChIP-qPCR analysis of LSD1 (e) and MBD3 (f) occupancy at the ZRANB1 gene locus in both PC-3 and U2OS cells with or without IR treatment. Data were shown as the mean ± SD of three independent experiments (n = 3). Two-tailed unpaired Student’s t-test. P values based on the order of appearance: in e (0.0001, 0.0002, 0.0046, and 7.3E-5) and f (0.0026, 0.0007, 0.0044, and 0.0021). g–j PC-3 and U2OS cells were infected with lentivirus expressing indicated shRNAs and harvested at the indicated time points (T) after IR for WB analysis (g, h) and RT-qPCR analysis (i, j). Data were shown as the mean ± SD of three independent experiments (n = 3). Two-tailed unpaired Student’s t-test. P values based on the order of appearance: in i (0.0002, 2.7E-6, 0.91, 0.4781, 0.0072, 0.001, 0.7017, and 0.7798) and in j (0.0094, 0.0005, 0.7659, 0.8925, 0.047, 0.0109, 0.5247, and 0.9567). k, l PC-3 and U2OS cells were synchronized with nocodazole (100 ng/ml) for 12 h and released into the cell cycle. At the indicated time points (T), cells were harvested for cell cycle analysis by FACS (k) and WB analysis (l). m–p PC-3 cells infected with lentivirus expressing indicated shRNAs were synchronized with nocodazole (100 ng/ml) for 12 h and released into the cell cycle. At the indicated time points, cells were harvested for WB analysis (m, o) and RT-qPCR analysis (n, p). Data were shown as the mean ± SD of three independent experiments (n = 3). n.s. not significant. P values based on the order of appearance: in n (0.0004, 1E-5, 0.0026, 0.8436, 0.9526, and 0.7412) and in p (0.0001, 3.6E-5, 0.0062, 0.4242, 0.4398, and 0.2789). q PC-3 cells were infected with lentivirus expressing indicated shRNAs transfected with His-Ub-K29-single construct and released from nocodazole treatment. Cells were harvested for ubiquitination assay using Ni-NTA pull-down at indicated time points. The sequencing data for CUT&Tag have been deposited to the GEO database with the accession code GSE222267. Source data are provided in this paper or the Mendeley database (https://data.mendeley.com/datasets/n9txt6y5cj/1). Similar results for (a, g, h, l, m, o, q) panels were obtained in two independent experiments.

